To add a pie 2D chart, add the data source on worksheet firstly:
using unvell.ReoGrid;
// ...

var worksheet = this.grid.CurrentWorksheet;

worksheet["A2"] = new object[,] {
  { null, 2008, 2009, 2010, 2011, 2012 },
  { "City 1", 3, 2, 4, 2, 6 },
};
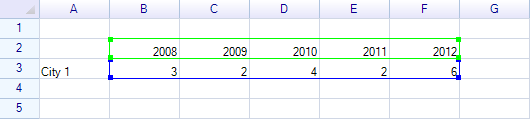
Define 2 ranges, data source range and title range, add these ranges into highlight ranges collection:
var dataRange = worksheet.Ranges["B3:F3"];
var titleRange = worksheet.Ranges["B2:F2"];

worksheet.AddHighlightRange(dataRange);
worksheet.AddHighlightRange(titleRange);
Result:
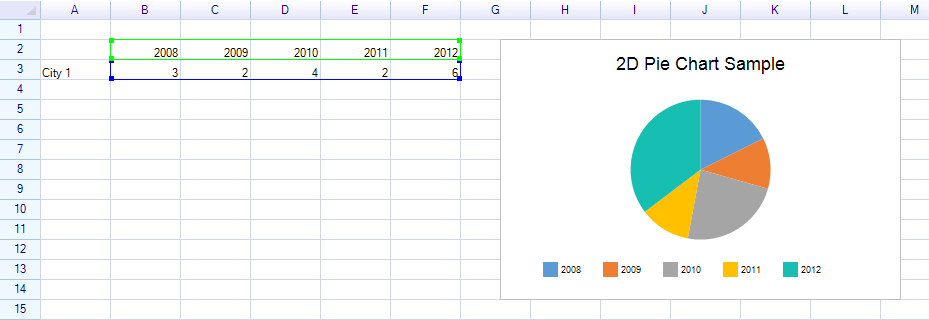
Create the pie chart instance:
Chart.Chart c1 = new Chart.Pie2DChart
{
  Location = new Graphics.Point(220, 160),
  Size = new Graphics.Size(400, 260),

  Title = "2D Pie Chart Sample",

  DataSource = new WorksheetChartDataSource(worksheet, RangePosition.Empty, dataRange)
  {
    CategoryNameRange = titleRange,
  },
};
Add the chart instance into worksheet, the chart will be displayed instantly:
worksheet.FloatingObjects.Add(c1);
The result: