Why this exists
Most AI tools today output text. Even after analyzing a spreadsheet — sorting rows, computing totals, building a forecast — the result lands in chat as a markdown table. You have to manually paste it into a real spreadsheet to act on it.
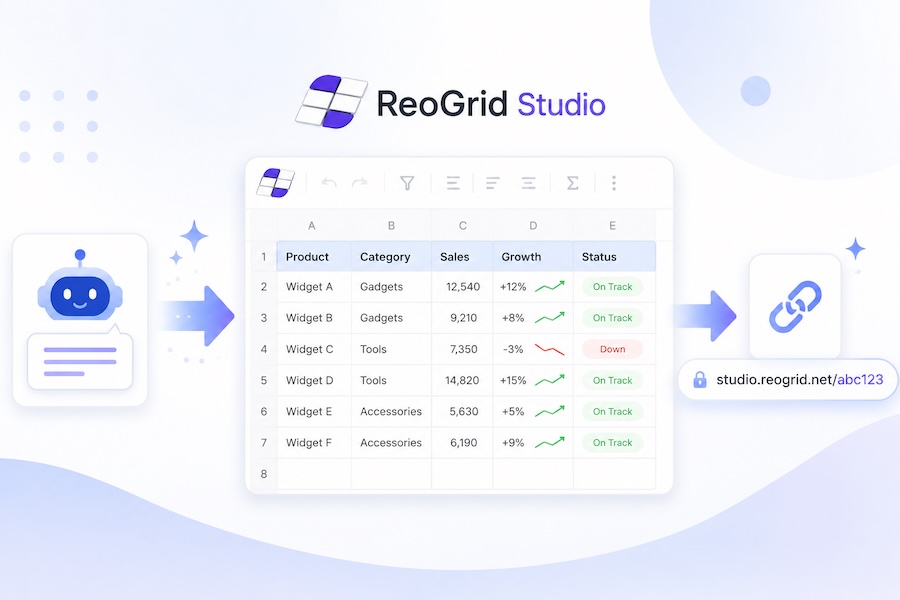
ReoGrid Studio closes that gap. It is a browser-hosted spreadsheet at studio.reogrid.net with a public, anonymous publish endpoint that any AI agent can write to via MCP (Model Context Protocol). The AI builds a spreadsheet, receives a short URL, and hands it back. The recipient opens the URL and sees a live, navigable spreadsheet — selectable, filterable, copyable, shareable.
Two roles
ReoGrid Studio has two roles, and they’re not equal.
1. Natural-language authoring
Open studio.reogrid.net, type what you want, see a spreadsheet:
“Make me a Q1 sales summary with three regions, monthly totals, and a SUM column.”
The grid renders live. Iterate via chat. Hit Publish & get URL to mint a short URL you can share. This is the on-ramp.
2. AI visualization endpoint (the main axis)
The strategic core of Studio. Any AI that has analyzed data can publish it as a real spreadsheet and hand the user the URL.
This is plumbed through MCP. An AI client — Claude Code, Claude Desktop, Cursor, or any application built on the Anthropic API — connects to https://api-studio.reogrid.net/studio/mcp and can:
- Read the spreadsheet schema (cells, styles, formulas, filters, frozen panes, etc.)
- Build a
ReoGridJsonDocumentfrom analyzed data - Publish it — receive a public URL
- Hand the URL to the user
Live examples
These were generated during validation. No scaffolding from us — the AI was given a task and discovered the surface autonomously:
- Asked Claude to summarize Q1 customer-support ticket volume → studio.reogrid.net/demoSalesH126A (title row, frozen header, 15 formulas, 7 styles)
- Asked Claude to generate a realistic engineering backlog with a header filter → studio.reogrid.net/demoInvFilter1 (filter, alternating rows, varied priorities/assignees)
For comparison, a hand-built example using more advanced features:
- Customer-satisfaction dashboard with rating stars and progress bars → studio.reogrid.net/demoCSATdash88
Try clicking around: cell selection works, ⌘+C copies with formatting (paste into Numbers, Excel, or Google Sheets and the styles survive), the filter dropdown narrows rows, freezes hold while you scroll.
What works today
The wire format is the canonical ReoGridJsonDocument from @reogrid/pro — the same JSON that powers ReoGrid in the browser. Features Studio supports on day one:
| Category | Examples |
|---|---|
| Core | Cell values, Excel-style formulas, shared styles, merges, borders |
| Layout | Frozen rows/columns, custom row heights / column widths, banded rows |
| Numbers | Custom number formats (currency, date, percentage, scientific) |
| Interaction | Auto-filter on a header range, sort, autofill, range copy/paste |
| Cell types | Checkbox, dropdown, rating (★), progress bar, sparkline, hyperlink, button |
| Conditional | Color scales, data bars, value-based highlighting, top-N |
| Rich | Rich-text runs (mixed bold/italic/color within a cell), outline grouping |
The public viewer is interactive read-only — viewers can select, scroll, copy, sort, filter, and click widgets, but cannot mutate the published data. This is the right shape for a “shared link” view: the recipient can explore freely, take what they need, and trust that what they’re seeing is the published snapshot.
Free, anonymous, rate-limited
ReoGrid Studio is completely free today. No login, no API key, no quota negotiation.
The only gate is a per-IP rate limit of 30 publishes per hour, which keeps the anonymous surface honest. Published sheets persist indefinitely; the short URLs are 14-character flickr-base58 (e.g. 9mkzWpAibo4K34).
A commercial plan with higher quotas and team features is on the roadmap, but concrete pricing and packaging are deliberately Phase 2 work — the bar to entry stays at zero while AI tooling integration scales up.
How it composes with your stack
Inside an AI app you’re building, the flow is:
your app  ──► AI analysis  ──► publish_sheet(doc)  ──► { url }
                                                        │
                                                        ▼
                          user opens https://studio.reogrid.net/{shortId}
The AI does the analysis, calls the MCP, gets back a URL, and the URL becomes part of its reply to the user. The user clicks. That is the whole interaction. No SDK to integrate on your side, no infrastructure to host, no data export pipeline.
Try it now
- In your browser: open studio.reogrid.net and describe what you want.
- From your AI client: see Use ReoGrid Studio from Claude Code (and other MCP clients) for the setup.
- From your application:
POST https://api-studio.reogrid.net/studio/mcp(JSON-RPC 2.0). The schema and tools are introspectable viatools/listandget_schema.
Anything an AI can analyze, it can now display as a real spreadsheet for you to act on.
Built on top of ReoGrid Web (@reogrid/pro), the browser-native sibling of ReoGrid for .NET. The shared ReoGridJsonDocument format means a sheet published from Studio can be loaded by any @reogrid/pro deployment — and vice versa.