
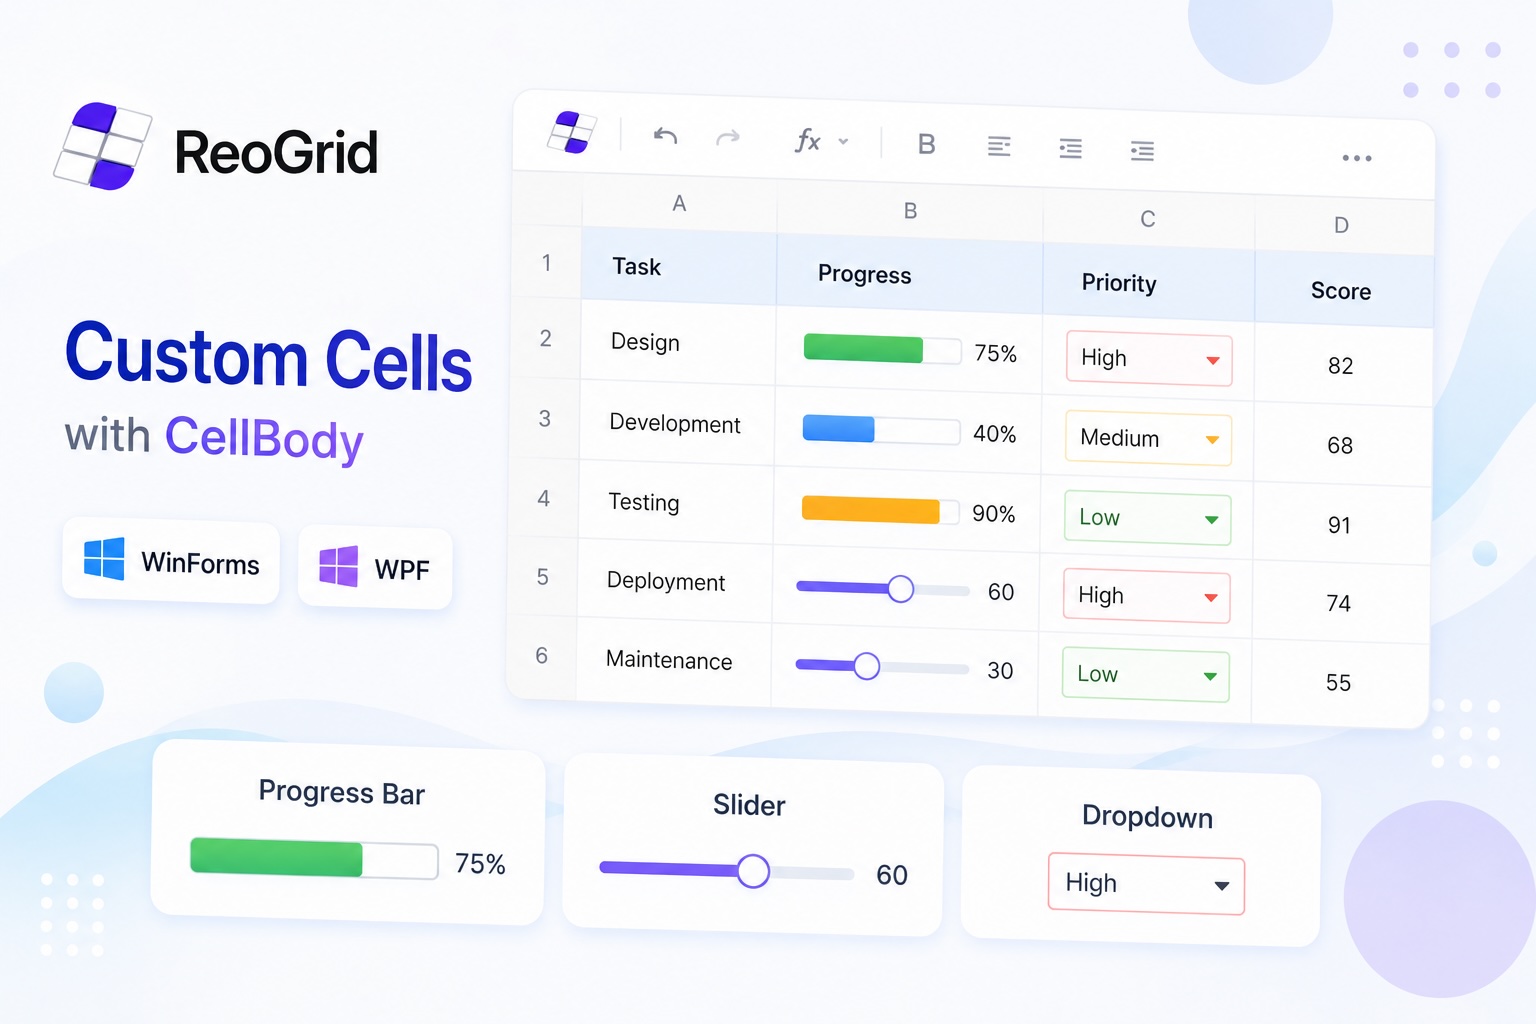
If all you need is flat data in a grid, DataGridView is fine. But the moment someone says “I want a progress bar in this column,” “this row should have a slider,” or “put a dropdown right in this cell,” standard controls start requiring a lot of scaffolding.
ReoGrid answers those requirements with a single concept: CellBody. Subclass it, override what you need, assign it to a cell — and you have full control over both rendering and interaction.
What is CellBody?
In ReoGrid, one class, CellBody, is both the “renderer” and the “editor.”
using unvell.ReoGrid.CellTypes;
using unvell.ReoGrid.Events;      // CellMouseEventArgs

public class MyCellBody : CellBody
{
    // Painting — called every time the cell is redrawn
    public override void OnPaint(CellDrawingContext dc) { ... }

    // Mouse events
    public override bool OnMouseDown(CellMouseEventArgs e) { ... }
    public override bool OnMouseMove(CellMouseEventArgs e) { ... }
    public override bool OnMouseEnter(CellMouseEventArgs e) { ... }
    public override bool OnMouseLeave(CellMouseEventArgs e) { ... }

    // Allow or block direct text editing
    public override bool OnStartEdit() { return false; }

    // Called when the body is assigned to a cell
    public override void OnSetup(Cell cell) { base.OnSetup(cell); }
}
Assigning it to a cell is a single indexer assignment:
var sheet = reoGridControl1.CurrentWorksheet;
sheet["B3"] = new MyCellBody();
Built-in CellBody types
Common use cases ship ready to use.
// Button
var btn = new ButtonCell("Run");
btn.Click += (s, e) => MessageBox.Show("Clicked!");
sheet["B2"] = btn;

// Checkbox
var chk = new CheckBoxCell();
chk.CheckChanged += (s, e) => Console.WriteLine(chk.IsChecked);
sheet["B4"] = chk;

// Radio buttons (linked via a group)
var group = new RadioButtonGroup();
sheet["B6"] = new RadioButtonCell { RadioGroup = group };
sheet["B7"] = new RadioButtonCell { RadioGroup = group };
sheet["B8"] = new RadioButtonCell { RadioGroup = group };

// Dropdown list
var dd = new DropdownListCell("Open", "In Progress", "Done", "Rejected");
dd.SelectedItemChanged += (s, e) => Console.WriteLine(dd.SelectedItem);
sheet["B10"] = dd;

// Hyperlink
sheet["B12"] = new HyperlinkCell("https://reogrid.net");

// Image
sheet["B14"] = new ImageCell(Image.FromFile("logo.png"));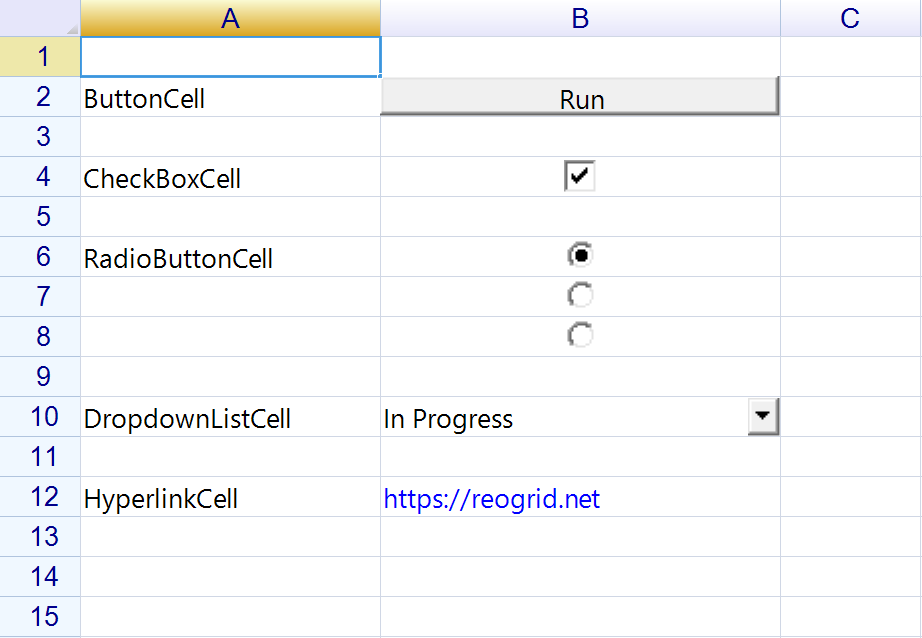
Assign one to a cell and it works as-is.
Example 1: Progress bar cell
Reads the cell value (0.0–1.0) and paints a gradient bar proportional to that value. This is the simplest possible CellBody implementation.
using unvell.ReoGrid.CellTypes;
using unvell.ReoGrid.Graphics;
using unvell.ReoGrid.Rendering;

public class ProgressBarCell : CellBody
{
    public SolidColor BarColor    { get; set; } = SolidColor.SteelBlue;
    public SolidColor BarColorEnd { get; set; } = SolidColor.SkyBlue;

    public override void OnPaint(CellDrawingContext dc)
    {
        double value = Cell.Worksheet.GetCellData<double>(Cell.Position);
        value = Math.Clamp(value, 0, 1);

        var bounds   = GetBodyBounds();
        int barWidth = (int)(value * bounds.Width);

        if (barWidth > 0)
        {
            var rect = new Rectangle(bounds.Left, bounds.Top + 1, barWidth, bounds.Height - 2);
            dc.Graphics.FillRectangleLinear(BarColor, BarColorEnd, 90f, rect);
        }

        // Let ReoGrid draw the formatted cell text on top
        dc.DrawCellText();
    }

    // Block direct text editing — value is set via API or formula
    public override bool OnStartEdit() => false;
}
Usage:
// Make column B a progress-bar column
for (int r = 2; r <= 11; r++)
    sheet[r, 1] = new ProgressBarCell();

// Set values (0.0–1.0)
sheet[2, 1] = 0.75;
sheet[3, 1] = 0.42;

// Apply percent format — cells now display "75%", "42%", etc.
sheet.SetRangeDataFormat(2, 1, 10, 1,
    DataFormat.CellDataFormatFlag.Percent,
    new DataFormat.NumberDataFormatter.NumberFormatArgs { DecimalPlaces = 0 });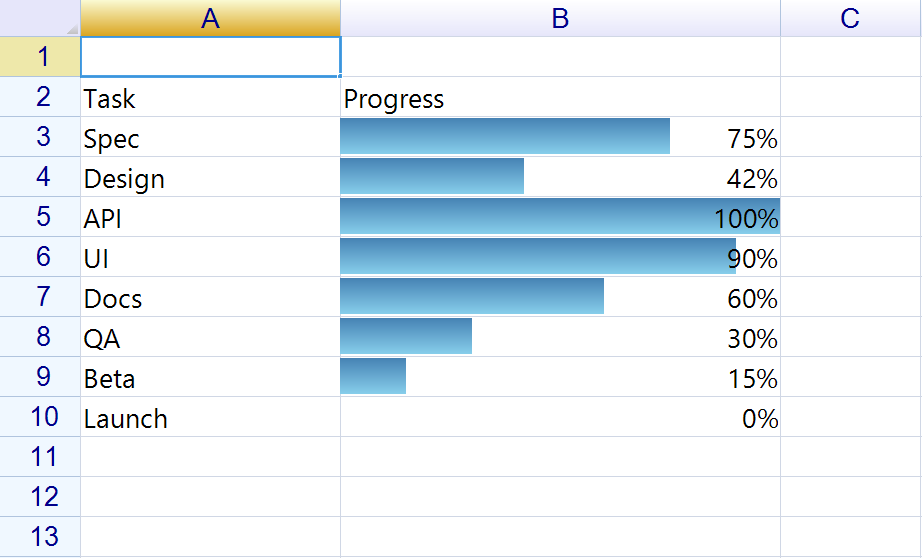
You can also drive the bar from a formula so it updates automatically:
// Column C = actual, Column D = target → Column B reflects the ratio live
sheet[2, 1] = "=C2/D2";
Example 2: Slider cell
Lets users drag a thumb inside the cell to change its value. OnMouseDown and OnMouseMove translate cursor position back into a 0–1 float and write it to the worksheet.
public class SliderCell : CellBody
{
    private bool isHover = false;

    public override void OnSetup(Cell cell)
    {
        base.OnSetup(cell);
    }

    public override void OnPaint(CellDrawingContext dc)
    {
        float value = 0;
        float.TryParse(dc.Cell.DisplayText, out value);
        value = Math.Clamp(value, 0f, 1f);

        var bounds  = Cell.GetBounds();
        var g       = dc.Graphics;
        int halfH   = (int)(bounds.Height / 2f);
        int sliderH = (int)Math.Min(bounds.Height - 4, 20);

        // Track background
        g.FillRectangle(4, halfH - 3, bounds.Width - 8, 6, SolidColor.Gainsboro);

        // Thumb
        int thumbX   = 2 + (int)(value * (bounds.Width - 12));
        var thumbRect = new Rectangle(thumbX, halfH - sliderH / 2, 8, sliderH);
        g.FillRectangle(thumbRect, isHover ? SolidColor.SeaGreen : SolidColor.LightGreen);
    }

    public override bool OnMouseDown(CellMouseEventArgs e)
    {
        SetValueFromX(e.RelativePosition.X);
        return true; // mark as handled — suppress default selection behaviour
    }

    public override bool OnMouseMove(CellMouseEventArgs e)
    {
        if (e.Buttons == unvell.ReoGrid.Interaction.MouseButtons.Left)
            SetValueFromX(e.RelativePosition.X);
        return false;
    }

    public override bool OnMouseEnter(CellMouseEventArgs e) { isHover = true;  return true; }
    public override bool OnMouseLeave(CellMouseEventArgs e) { isHover = false; return true; }

    public override bool OnStartEdit() => false;

    private void SetValueFromX(float x)
    {
        float value = x / (Cell.GetBounds().Width - 2f);
        value = Math.Clamp(value, 0f, 1f);
        Cell.Worksheet.SetCellData(Cell.Position, Math.Round(value, 2));
    }
}
Linking a slider to a progress bar in another cell is just a formula:
// E5 — slider
sheet["E5"] = new SliderCell();
sheet["E5"] = 0.5;

// D5 — progress bar driven by the slider value
sheet["D5"] = new ProgressBarCell();
sheet["D5"] = "=E5";

// C5 — numeric readout
sheet["C5"] = "=E5";
sheet.SetRangeDataFormat("C5", DataFormat.CellDataFormatFlag.Percent,
    new DataFormat.NumberDataFormatter.NumberFormatArgs { DecimalPlaces = 0 });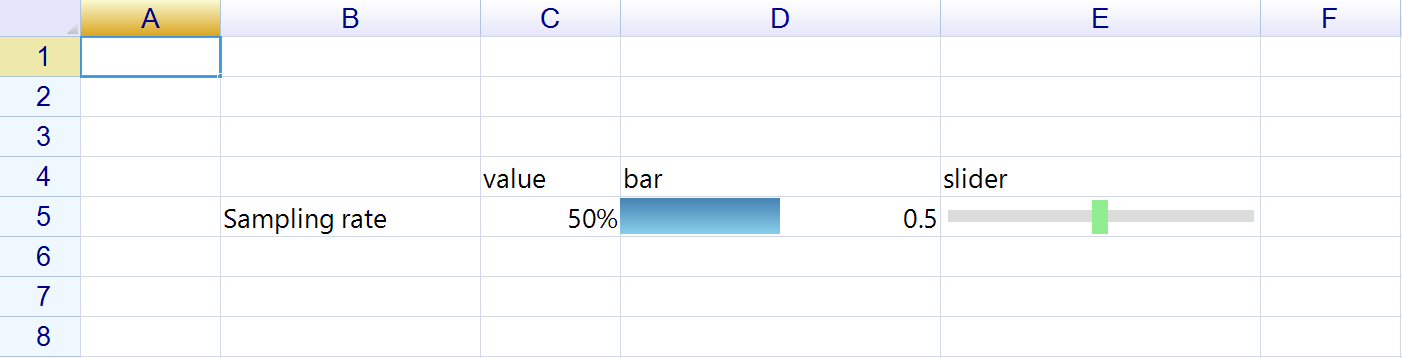
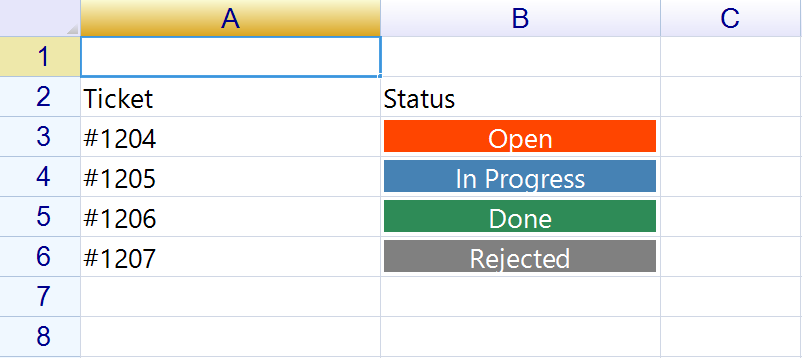
Example 3: Status badge cell
A common requirement in business apps is a “Status” column that reads like a label but looks like a coloured badge. The body reads Cell.DisplayText and switches background colour accordingly.
public class StatusBadgeCell : CellBody
{
    private static readonly Dictionary<string, SolidColor> StatusColors = new()
    {
        ["Open"]        = SolidColor.OrangeRed,
        ["In Progress"] = SolidColor.SteelBlue,
        ["Done"]        = SolidColor.SeaGreen,
        ["Rejected"]    = SolidColor.Gray,
    };

    public override void OnPaint(CellDrawingContext dc)
    {
        string text   = Cell.DisplayText;
        var    bounds = GetBodyBounds();

        var bgColor = StatusColors.TryGetValue(text, out var c) ? c
            : new SolidColor(200, SolidColor.Silver);

        // Badge background
        var rect = new Rectangle(
            bounds.Left + 2, bounds.Top + 2,
            bounds.Width - 4, bounds.Height - 4);
        dc.Graphics.FillRectangle(rect, bgColor);

        // White label text, centred
        dc.Graphics.DrawText(
            text,
            dc.Cell.CalcedStyle?.FontName ?? "Segoe UI",
            dc.Cell.CalcedStyle?.FontSize ?? 9f,
            SolidColor.White,
            bounds,
            ReoGridHorAlign.Center,
            ReoGridVerAlign.Middle);
    }

    // Allow typing to change the status directly
    public override bool OnStartEdit() => true;
}
To pair it with a dropdown, inherit from DropdownListCell instead and override OnPaint there.
CellBody in WPF
The WPF edition uses the same CellBody inheritance model, and CellDrawingContext.Graphics offers the same drawing API on both platforms. The calling code is identical:
// WinForms
dc.Graphics.FillRectangleLinear(color1, color2, 90f, rect);

// WPF — the same call
dc.Graphics.FillRectangleLinear(color1, color2, 90f, rect);
If you share a class library between WinForms and WPF projects, one CellBody subclass compiles and works in both.
Applying a CellBody to a range
Override Clone() so each cell gets its own independent instance:
public class ProgressBarCell : CellBody
{
    // ... painting code

    public override ICellBody Clone()
    {
        return new ProgressBarCell
        {
            BarColor    = this.BarColor,
            BarColorEnd = this.BarColorEnd,
        };
    }
}

// Apply to a column in one loop
for (int r = 1; r <= 20; r++)
    sheet[r, 2] = new ProgressBarCell { BarColor = SolidColor.Coral };
Without Clone(), bulk APIs like SetRangeData may share a single instance across cells, which can cause surprising state bugs.
Quick reference
| Goal | Approach |
|---|---|
| Use a ready-made dropdown / checkbox | DropdownListCell / CheckBoxCell as-is |
| Visualise a value graphically | Override CellBody.OnPaint |
| Let mouse interaction change a value | Override OnMouseDown / OnMouseMove |
| Block direct text entry | Return false from OnStartEdit |
| Share one class across WinForms and WPF | Put the subclass in a shared class library |
| Apply to a range safely | Override Clone() |
CellBody goes beyond changing the look — it turns the entire cell into a custom UI component. The same pattern scales from simple progress bars to calendar pickers, star-rating inputs, or anything else that belongs in a cell.