
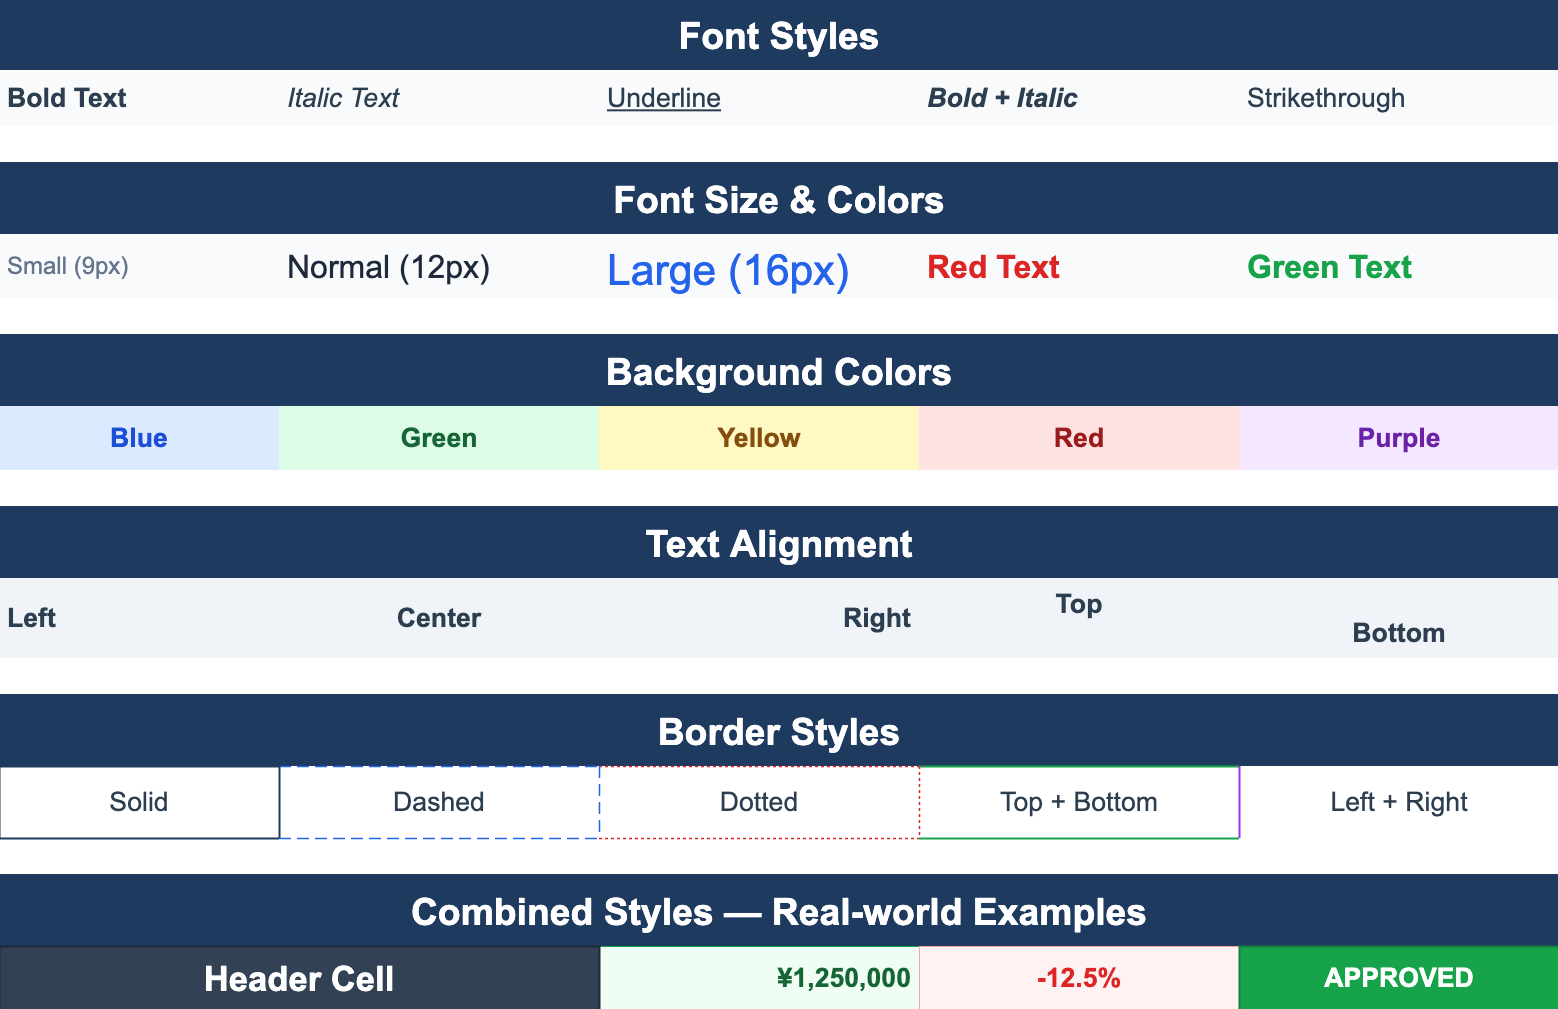
Conditional formatting is one of those Excel features users do not appreciate until it disappears. Color the negative numbers red. Highlight the row whose status is “Overdue.” Show a green data bar in the ”% complete” column. Add it to your .NET app and the screen suddenly tells the user what to look at.
This post walks through how conditional formatting actually works under the hood, the patterns that scale, and the ones that don’t.
The mental model
A conditional formatting rule has three parts:
- A range it applies to —
A1:A1000, the whole sheet, etc. - A condition — a formula or a comparison that evaluates to a boolean per cell
- A style — what to apply when the condition is true (font color, fill, border, data bar, icon)
In Excel and in any library that round-trips to .xlsx, the rule itself is stored once on the sheet, not copied per cell. The renderer evaluates it on the fly when each cell is drawn. This matters for performance — more on that below.
A first rule
The classic case: highlight values above a threshold.
using unvell.ReoGrid.ConditionalStyle;   // Rule

sheet.ConditionalStyles.Add(new Rule(
    "THIS > 100",                       // condition (THIS = the cell value)
    "A1:A1000",                          // range
    new WorksheetRangeStyle
    {
        Flag      = PlainStyleFlag.TextColor | PlainStyleFlag.BackColor,
        TextColor = SolidColor.White,
        BackColor = SolidColor.Red,
    }));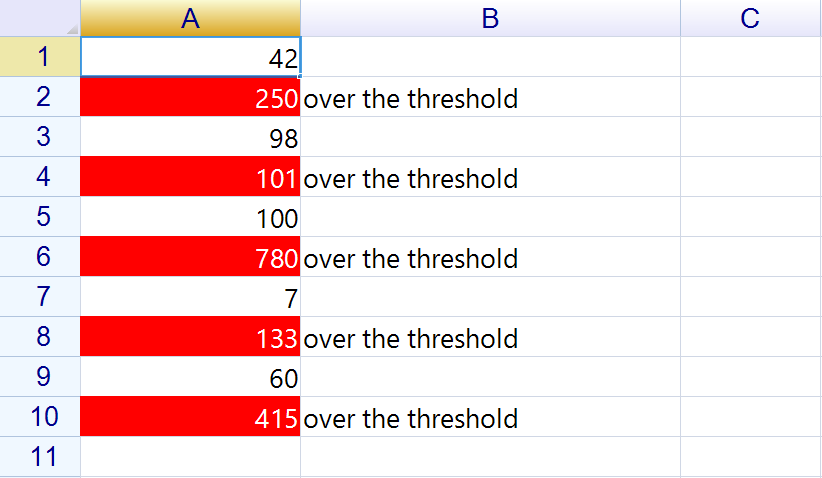
Now any cell in A1:A1000 whose value exceeds 100 is shown white-on-red. Set A37 = 250 and the cell repaints. Set it to 50 and the formatting goes away. No event wiring needed.
What a rule can and cannot see
A rule’s formula is evaluated once for every cell in the applied range, and THIS is the value of the cell being tested. That is the whole of the per-cell context in V4: the addresses you write in the formula are not shifted to the cell being tested.
That matters for the request that comes up most often — when column F says "Overdue", colour the entire row. In Excel you write it with an absolute-column / relative-row reference:
// Excel's idiom — but in ReoGrid V4 this colours nothing.
sheet.ConditionalStyles.Add(new Rule(
    "$F1 = \"Overdue\"",
    "A1:Z1000",
    new WorksheetRangeStyle { Flag = PlainStyleFlag.BackColor, BackColor = SolidColor.LightCoral }));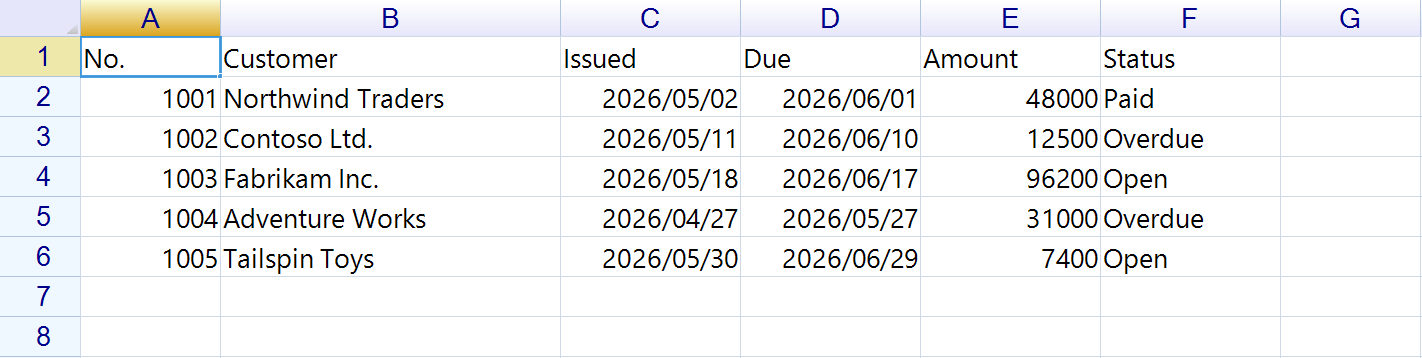
$F1 stays $F1 for every cell in the range, so the rule is decided by the single cell F1 and applies to all of the range or none of it (reogrid-v4#15). In V4, keep rules to conditions about the cell itself, and colour rows the ordinary way:
// Row highlighting in V4: style the row when its status changes.
var overdue = new WorksheetRangeStyle
{
    Flag = PlainStyleFlag.BackColor,
    BackColor = SolidColor.LightCoral,
};

for (int r = 1; r <= lastRow; r++)
{
    if ((sheet[r, 5] as string) == "Overdue")
        sheet.SetRangeStyles(new RangePosition(r, 0, 1, 26), overdue);
}
ReoGrid V5 implements the OOXML rule set, expression rules included, where the reference is offset per cell and the Excel idiom above works as written.
Data bars and icon sets
ReoGrid V4 has one rule type — a formula plus a WorksheetRangeStyle. There is no DataBarRule, no colour scale, and no icon set: those arrived with ReoGrid V5, which implements the OOXML set and round-trips it through .xlsx.
On V4 a data bar is a painting job rather than a rule. A custom cell body draws the bar behind the cell’s own text, which is a dozen lines and gives you the colours and geometry you want:
public class ProgressBarCell : CellBody
{
    public override void OnPaint(CellDrawingContext dc)
    {
        double value = Math.Clamp(Cell.Worksheet.GetCellData<double>(Cell.Position), 0, 1);
        var bounds   = GetBodyBounds();
        int barWidth = (int)(value * bounds.Width);

        if (barWidth > 0)
        {
            var rect = new Rectangle(bounds.Left, bounds.Top + 1, barWidth, bounds.Height - 2);
            dc.Graphics.FillRectangleLinear(SolidColor.SteelBlue, SolidColor.SkyBlue, 90f, rect);
        }

        dc.DrawCellText();   // the formatted value on top of the bar
    }
}
The difference that matters for .xlsx users: a rule round-trips to Excel, a CellBody does not — it is your code drawing, and the saved file has plain cells.
Performance: where it goes wrong
The naïve implementation of “evaluate every rule against every cell on every paint” is fast enough for small ranges and disastrous for large ones. Some rules of thumb:
- Apply rules to actual data ranges, not entire columns. A rule scoped to
A:Aevaluates against every cell Excel could potentially have (1,048,576 of them). Scope toA1:A1000instead and the engine only looks where data lives. - Avoid rules whose condition is itself an expensive formula. A rule like
VLOOKUP(...)evaluated per cell, per repaint, is not a rule — it’s a benchmark. - Watch out for bulk inserts under conditional formatting. Inserting 5,000 cells one-by-one when each insert triggers re-evaluation of overlapping rules is the worst case. ReoGrid 4.4 specifically optimized this path — bulk loading under one conditional rule is now around 11,700× faster than 4.3.13. See the v4.4 release notes for measured numbers.
- Batch rule changes. If you are adding ten rules in a loop, suspend repaint, add them, then resume. Don’t repaint per rule.
The pattern that scales: scope rules tightly, keep conditions cheap, and use bulk insert APIs (SetRangeData) when populating data into a range that already has rules.
Round-tripping to .xlsx
If your users export to Excel, you want the formatting to survive the trip. Two compatibility points worth knowing:
- Stick to standard rule types. “Cell value compares X,” “formula is true,” “top/bottom N,” “duplicate values,” “data bars,” “color scales,” and “icon sets” are all in the OpenXML spec and round-trip cleanly.
- Custom one-off styles (gradients with specific stops, fonts you set programmatically) round-trip, but the rule semantics must be expressible in OpenXML. A condition that calls a user-defined .NET function will not survive the export — it has no Excel equivalent.
The safe heuristic: if you can describe the rule entirely in Excel’s “New Rule” dialog without writing custom VBA, it round-trips.
Removing rules
Two operations every implementation needs:
// Remove all rules from a sheet
sheet.ConditionalStyles.Clear();

// Check whether a specific cell is currently formatted by any rule
bool isFormatted = sheet.HasConditionalStyle(new CellPosition("A37"));
The HasConditionalStyle check is useful for “is this cell really red, or just looking red because of a rule?” — common when implementing copy/paste behavior or building a style inspector for users.
When to reach for it
Conditional formatting is usually the right tool when:
- Users need to scan the data, not analyze it
- The visual cue depends on the data itself, not on UI state
- You want behavior that is the same in Excel and in your app
It is the wrong tool when the highlighting depends on selection, hover, or app-level state — those are UI concerns and belong in your control’s drawing logic, not in the workbook.