
Conditional formatting implements the full OOXML rule set. It round-trips through XLSX and looks the same when opened in Excel (bar a few extension-only features — see Limitations).
Rules are evaluated only for visible cells, so applying one across a million-row range costs no more to draw than what is on screen.
The namespace is unvell.ReoGrid.Core.ConditionalFormatting.
Comparing values (cellIs)
using unvell.ReoGrid.Core;
using unvell.ReoGrid.Core.ConditionalFormatting;

ws.AddConditionalFormat(range, new CellIsRule
{
	Operator = CfOperator.GreaterThan,
	Value1 = CfValue.Num(100),
	Style = new CfStyle { BackgroundColor = 0xFFFFC7CE, Color = 0xFF9C0006 },
});

// "between" uses Value2 as well
ws.AddConditionalFormat(range, new CellIsRule
{
	Operator = CfOperator.Between,
	Value1 = CfValue.Num(0),
	Value2 = CfValue.Num(50),
	Style = new CfStyle { Bold = true },
});
CfOperator has eight members: Equal, NotEqual, GreaterThan, LessThan,
GreaterThanOrEqual, LessThanOrEqual, Between, NotBetween.
Operands are built with CfValue.Num(...) or CfValue.Str(...).
Formulas (expression)
// a formula is evaluated relative to the top-left cell of its range
ws.AddConditionalFormat(range, new ExpressionRule
{
	Formula = "MOD(ROW(),2)=0",
	Style = new CfStyle { BackgroundColor = 0xFFF7F7F7 },
});
The formula is evaluated relative to the range’s top-left cell, shifted for each cell.
$-pinned references and ROW() / COLUMN() are supported.
Text (containsText)
ws.AddConditionalFormat(range, new ContainsTextRule
{
	Operator = CfTextOperator.Contains,
	Text = "error",
	Style = new CfStyle { Color = 0xFFCC0000, Bold = true },
});
CfTextOperator is Contains / NotContains / BeginsWith / EndsWith. Matching is
case-insensitive by default. (CaseSensitive changes that, but OOXML has no way to express
the distinction, so it is not saved to XLSX.)
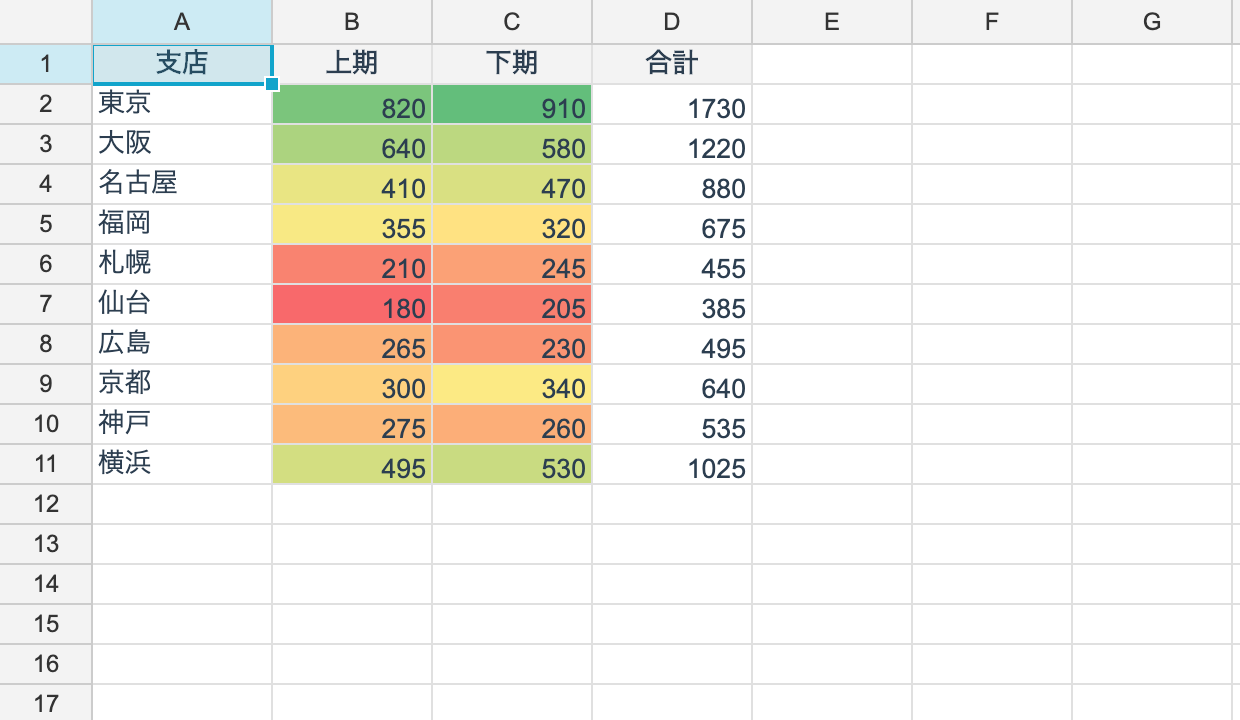
Color scales
// a three-color scale
ws.AddConditionalFormat(range, new ColorScaleRule
{
	Min = Cfvo.AutoMin,
	Mid = Cfvo.Percentile(50),
	Max = Cfvo.AutoMax,
	MinColor = 0xFFF8696B,
	MidColor = 0xFFFFEB84,
	MaxColor = 0xFF63BE7B,
});
Setting Mid and MidColor to null gives you a two-color scale.
Thresholds (Cfvo)
| Built with | Meaning |
|---|---|
Cfvo.AutoMin / Cfvo.AutoMax | The range’s minimum / maximum |
Cfvo.Number(v) | A fixed value |
Cfvo.Percent(v) | A linear percentage between min and max |
Cfvo.Percentile(v) | A percentile of the values |
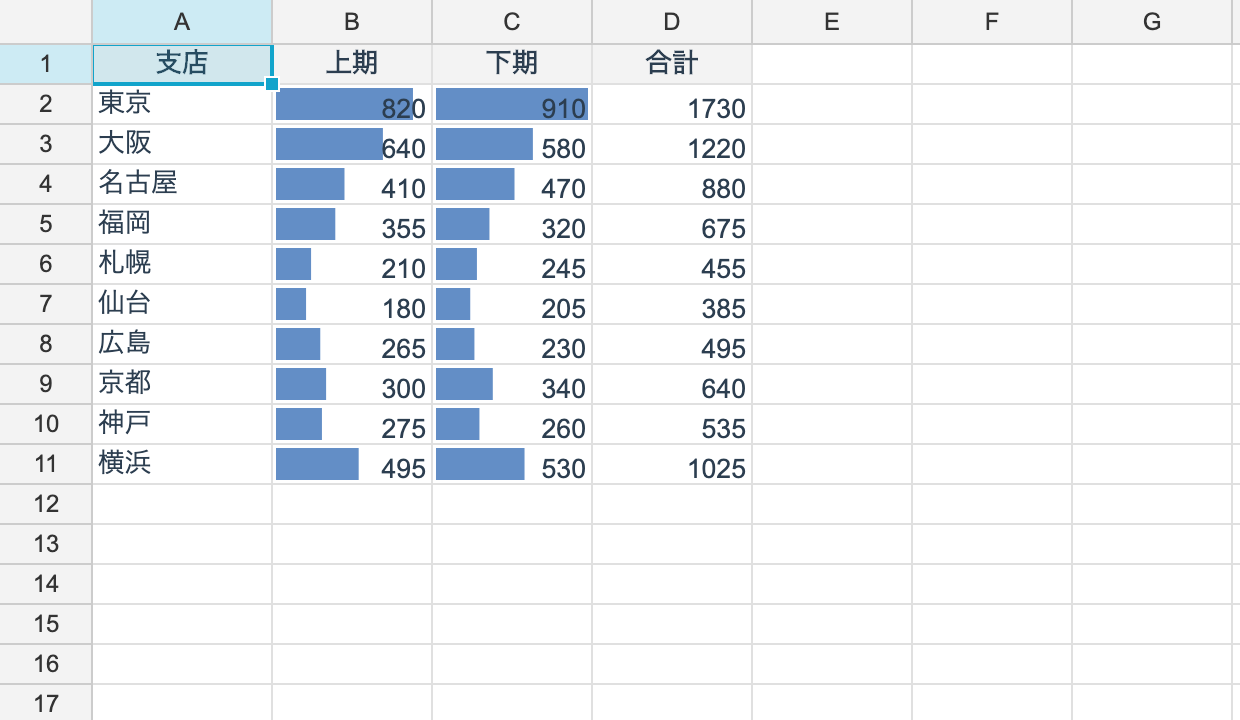
Data bars
ws.AddConditionalFormat(range, new DataBarRule
{
	Min = Cfvo.Number(0),
	Max = Cfvo.AutoMax,
	FillColor = 0xFF638EC6,
	NegativeFillColor = 0xFFFF555A,
	ShowValue = true,
});
When a range mixes positive and negative values, a zero axis is placed automatically and
negative bars grow leftwards. ShowValue = false hides the cell’s text for a bar-only look.
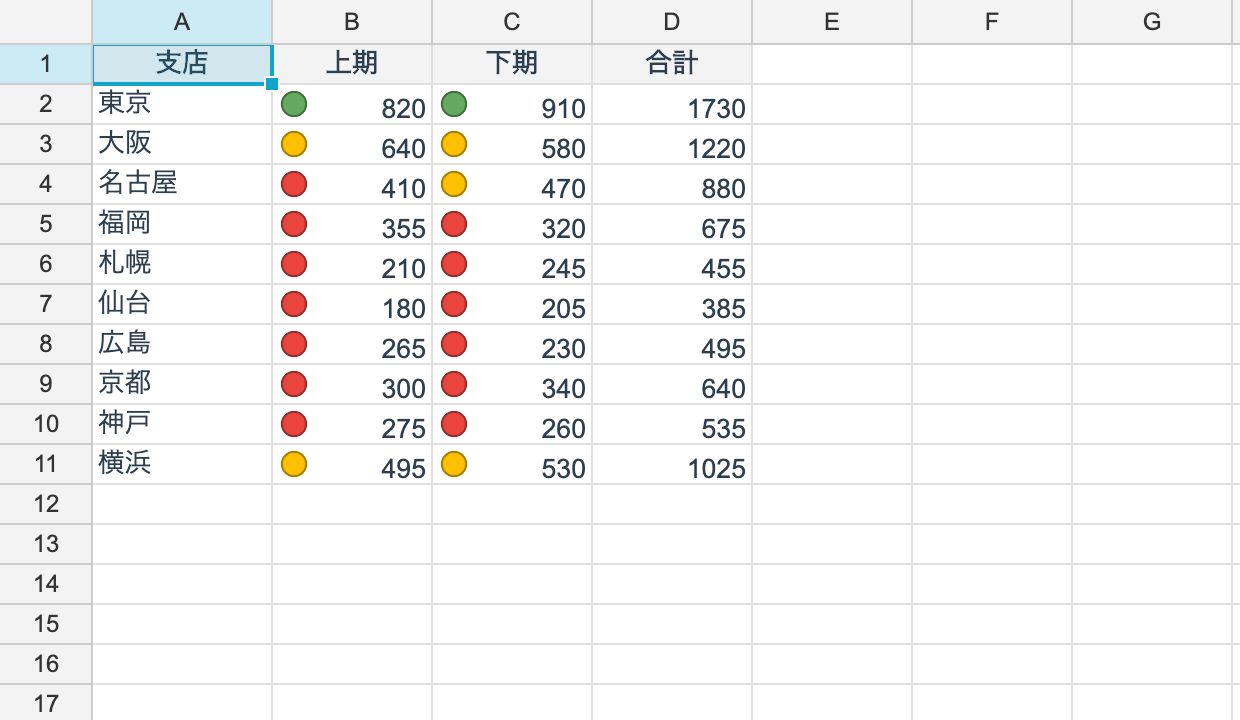
Icon sets
ws.AddConditionalFormat(range, new IconSetRule
{
	IconSet = "3TrafficLights1",
	Thresholds = [Cfvo.AutoMin, Cfvo.Percent(33), Cfvo.Percent(67)],
	ShowValue = true,
});
The standard OOXML sets are supported.
3Arrows 3ArrowsGray 3Flags 3TrafficLights1 3TrafficLights2 3Signs 3Symbols 3Symbols2 |
4Arrows 4ArrowsGray 4RedToBlack 4Rating 4TrafficLights |
5Arrows 5ArrowsGray 5Rating 5Quarters |
3Stars 3Triangles 5Boxes |
Reverse = true flips the icon order. Give Thresholds as many entries as the set has icons
(IconSets.DefaultThresholds(n) returns the defaults).
Icons draw on the left of the cell with the value to their right. The drawing is shared by all four targets: WinForms, WPF, Avalonia and PDF.
Rank, average and duplicates
ws.AddConditionalFormat(range, new Top10Rule
{
	Rank = 10,
	Percent = true,                 // the top 10%
	Style = new CfStyle { Bold = true },
});

ws.AddConditionalFormat(range, new AboveAverageRule
{
	StdDev = 1,                     // above mean + 1 sigma
	Style = new CfStyle { BackgroundColor = 0xFFE2EFDA },
});

ws.AddConditionalFormat(range, new DuplicateValuesRule
{
	Unique = false,                 // highlight duplicates
	Style = new CfStyle { Color = 0xFF9C0006 },
});Top10Rule—Bottom = truefor the bottom instead. Ties at the threshold are included, as in ExcelAboveAverageRule—BelowAveragefor the other side;StdDevgives a multiple of the standard deviationDuplicateValuesRule—Unique = truefor “values that appear exactly once”
Priority and management
string id = ws.AddConditionalFormat(range, new CellIsRule
{
	Operator = CfOperator.LessThan,
	Value1 = CfValue.Num(0),
	Priority = 1,
	StopIfTrue = true,
	Style = new CfStyle { Color = 0xFFCC0000 },
});

ws.RemoveConditionalFormat(id);

int count = ws.ConditionalFormats.Count;
bool any = ws.HasConditionalFormats;
Lower Priority wins (as in Excel). When a rule with StopIfTrue = true matches, no
lower-priority rule is evaluated.
When several rules match, the higher-priority one keeps the properties it sets, and the properties it leaves unset are filled in from the next rule down.
CfStyle
The overlay applied when a condition matches. It corresponds to XLSX’s <dxf>.
| Property | Type |
|---|---|
BackgroundColor / Color | uint? (ARGB) |
Bold / Italic / Underline | bool? |
The cell’s own style is not modified — conditional formatting is drawn on top of the effective style.
Reading the evaluated result
if (ws.TryEvaluateConditionalFormat(0, 0, out CfCellFormat fmt) && !fmt.IsEmpty)
{
	Console.WriteLine(fmt.Fill);        // the fill (what cellIs / colorScale produced)
	Console.WriteLine(fmt.TextColor);
	Console.WriteLine(fmt.DataBar);     // how to draw the data bar (null when there is none)
	Console.WriteLine(fmt.Icon);        // which icon the icon set chose
}
This is for implementing a custom drawing layer. An ordinary application never needs it.
Following structural changes
The range a rule applies to follows row and column insertion and deletion automatically.
Limitations
When writing to XLSX, the following cannot be expressed in standard OOXML and are not saved.
- A data bar’s negative color, zero axis and border (these need Excel’s x14 extension)
ContainsTextRule’sCaseSensitive
They are still drawn as specified, and they are saved in reogrid-json.