
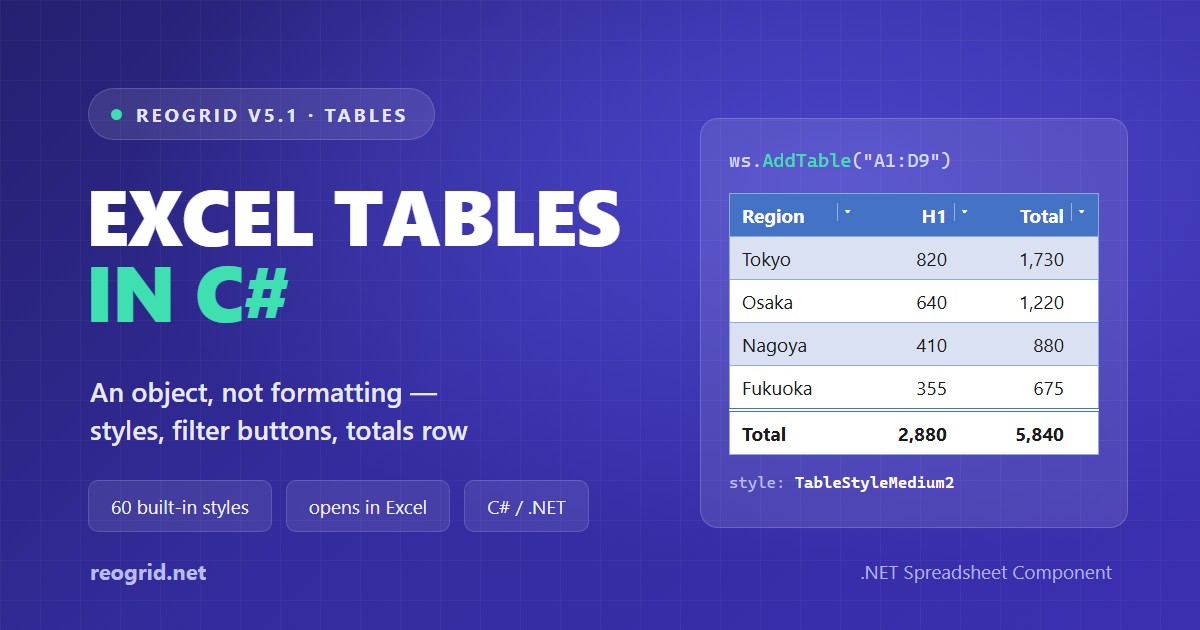
Select a list in Excel, press Ctrl+T, and it turns blue: a filled header, every other row tinted, dropdowns on the header row. It looks like formatting. It is not. Save the workbook, open the file up, and not one of those cells has a fill. What Excel wrote instead is an object — a table, a ListObject in Excel’s object model — that says: A1:D9 is a table, its first row is the header, draw it as TableStyleMedium2. The colours are worked out from each cell’s position in the table, every time the sheet is drawn.
When you generate spreadsheets from code, that difference is everything. Paint the header and the stripes yourself and you get something that looks like a table and behaves like a painted range: sort it and the stripes travel with the rows, insert a row and the pattern breaks, and Excel’s Table Design tab never appears.
This article looks at what a table is inside an .xlsx file, what the style name stands for, and the three details that decide whether Excel will open the file at all. Then it builds one in C# with ReoGrid V5.
The short version
| Cells you painted | An Excel table | |
|---|---|---|
| What the file holds | a fill in every cell | a range, a header row and a style name |
| Insert a row in the middle | the pattern breaks | the rows below are re-banded |
| Sort | the stripes move with the rows | the stripes stay where they were |
| Filter | two tinted rows can end up side by side | the visible rows are re-banded |
| Change the look | repaint every cell | change one name |
| What Excel sees | a range | a table: Table Design, filter buttons, a totals row |
What a table is inside an .xlsx
A table is a part of its own, xl/tables/table1.xml, linked from the worksheet by a <tableParts> entry. This is the one the code later in this article writes — a sales list in A1:D9 with a header row and a totals row:
<table id="1" name="Sales" displayName="Sales" ref="A1:D9" totalsRowCount="1">
  <autoFilter ref="A1:D8"/>
  <tableColumns count="4">
    <tableColumn id="1" name="Region" totalsRowLabel="Total"/>
    <tableColumn id="2" name="H1" totalsRowFunction="custom">
      <totalsRowFormula>SUBTOTAL(109,B2:B8)</totalsRowFormula>
    </tableColumn>
    <!-- H2 and Total: the same as H1 -->
  </tableColumns>
  <tableStyleInfo name="TableStyleMedium2" showFirstColumn="0" showLastColumn="0"
                  showRowStripes="1" showColumnStripes="0"/>
</table>
Four things in there matter:
nameis an identifier, not a label. It is what a structured reference spells —Sales[H1]— so it follows the rules for defined names: a letter or underscore first, then letters, digits,.and_. No spaces, and nothing that reads as a cell address:Q1andT1are cells, not names.- The
tableColumnnames come from the header row, and they must be unique — which is why a table over two columns both headed “Qty” calls the second oneQty2. tableStyleInfois the entire look: a style name and four switches — banded rows, banded columns, first column, last column. There is no colour anywhere in the file. The fills Excel shows come from the definition ofTableStyleMedium2, which Excel already knows.- The filter lives here, inside the table, not on the sheet. More on that below.
The style name is all Excel saves
Excel has 60 built-in table styles — Light 1–21, Medium 1–28, Dark 1–11 — and an application reading the file is expected to know what each name looks like. What each one contains is published: ECMA-376, the standard behind .xlsx, defines them in a file called presetTableStyles.xml. Each style is a set of elements — the whole table, the header row, the totals row, the first and last columns, the first and second row stripe, the first and second column stripe — each with its own fill, font and borders, all in theme colours.
Two things in those definitions are easy to get wrong if you imitate a table by hand:
- The stripe starts on the first data row. The built-ins tint the first row stripe, so the row right under the header is shaded and the next one is not. Start your own banding one row later and it will look off by one next to a real table.
- The families differ in structure, not just in colour. Medium 2, the default, has a filled header and thin rules between the rows. Light 1–7 have no header fill at all — a rule above and below, and the text in the accent’s darker shade. Light 8–14 fill the header and rule between the bands instead of tinting them; Light 15–21 are a full grid. The Dark styles fill the whole table.
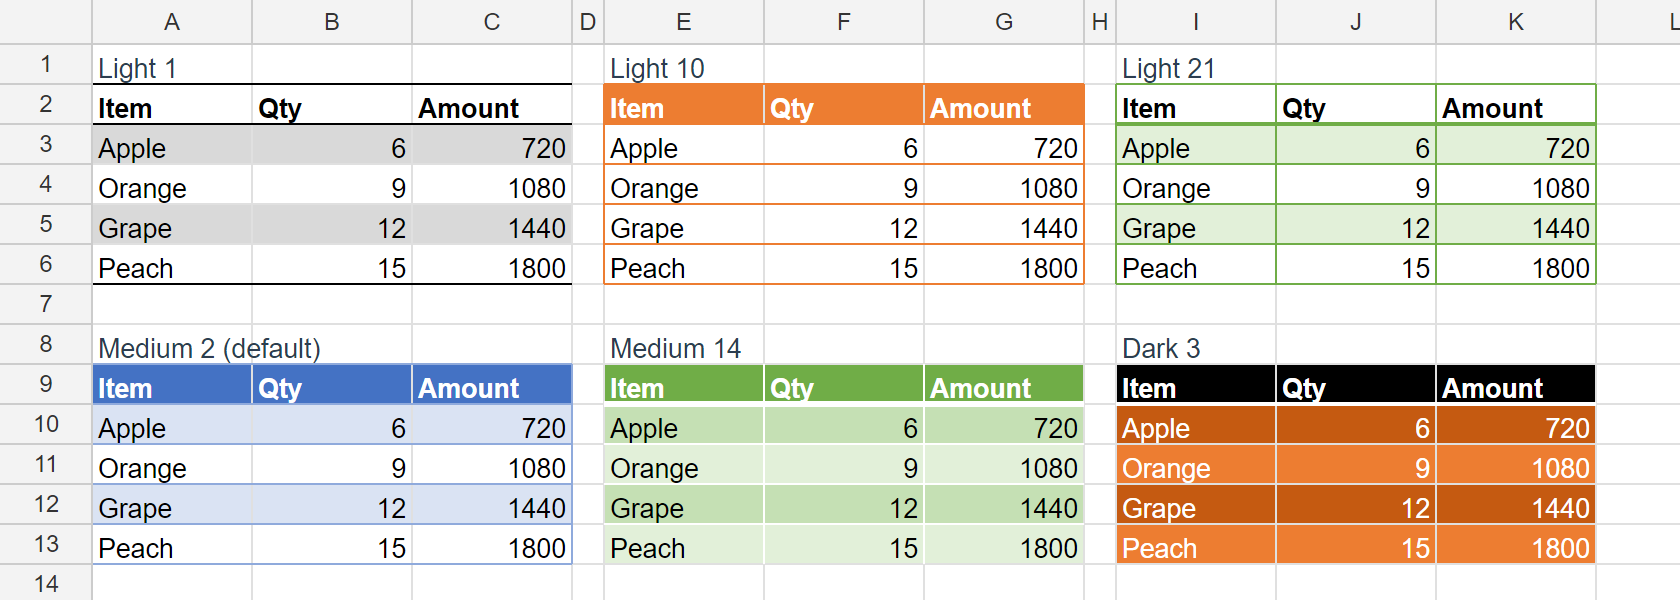
AddTable with a different Style name; nothing else changes.ReoGrid V5 has all 60 definitions built in, as published, and computes theme colours the same way Office does — within a unit or two of Excel’s own swatches (Medium 2’s stripe comes out #DAE3F3, Excel’s is #D9E1F2).
Because the file stores only a name, a custom style is only as portable as its definition. Excel keeps custom styles in the workbook’s styles.xml; a name with no definition behind it opens as a plain, unstyled table. For files meant to be opened in Excel, pick one of the 60.
Three details that decide whether Excel opens the file
A table part is small, and Excel is strict about it. Each of the following, if it is wrong, produces a file the desktop Excel refuses to open — not a “We found a problem… repair?” prompt but a refusal, with repair failing too. We checked each one by editing the XML by hand and opening the result in Excel.
- The filter belongs to the table. The dropdowns on a table’s header are the
<autoFilter>inside the table part. A sheet-level<autoFilter>that overlaps a table stops the file from opening. - The filter stops above the totals row. The table is
A1:D9; its filter isA1:D8. That is also why filtering never hides the totals. - Everything in the totals row is declared on its column. Text is a
totalsRowLabel; a formula is atotalsRowFunction—sum,average, …, orcustomwith a<totalsRowFormula>. A value or formula in the totals row that the table was not told about is enough to make the file unreadable.
When Excel builds a totals row itself, it writes SUBTOTAL(109,Sales[Total]) into the cell — 109 rather than 9, so that rows the filter hides and rows hidden by hand both drop out of the total. SUBTOTAL vs AGGREGATE explains the numbers.
Creating a table in C# — ReoGrid V5.1
The code runs headless, without a control or any UI, and is identical on WinForms, WPF and Avalonia.
using unvell.ReoGrid.Core;
using unvell.ReoGrid.Core.Tables;
using unvell.ReoGrid.IO.Excel;

var workbook = new Workbook();
var ws = workbook.AddWorksheet("Sales");

string[] header = ["Region", "H1", "H2", "Total"];
for (int c = 0; c < header.Length; c++) ws.SetText(0, c, header[c]);

(string Region, double H1, double H2)[] rows =
[
    ("Tokyo", 820, 910), ("Osaka", 640, 580), ("Nagoya", 410, 470), ("Fukuoka", 355, 320),
    ("Sapporo", 210, 245), ("Sendai", 180, 205), ("Hiroshima", 265, 230),
];
for (int r = 0; r < rows.Length; r++)
{
    ws.SetText(r + 1, 0, rows[r].Region);
    ws.SetNumber(r + 1, 1, rows[r].H1);
    ws.SetNumber(r + 1, 2, rows[r].H2);
    ws.SetFormula(r + 1, 3, $"B{r + 2}+C{r + 2}");
}

// The totals row: V5 styles it, the formulas are yours
ws.SetText(8, 0, "Total");
ws.SetFormula(8, 1, "SUBTOTAL(109,B2:B8)");
ws.SetFormula(8, 2, "SUBTOTAL(109,C2:C8)");
ws.SetFormula(8, 3, "SUBTOTAL(109,D2:D8)");
ws.SetNumberFormat(RangePosition.Parse("B2:D9"), "#,##0");

// A1:D9 becomes a table: row 1 is the header, row 9 the totals row
var table = ws.AddTable("A1:D9", new AddTableOptions
{
    Name = "Sales",            // an identifier: no spaces, and nothing that reads as a cell
    TotalsRowCount = 1,
    ShowFilterButton = true,   // dropdowns on the header row
});

XlsxWriter.Write(workbook, "sales.xlsx");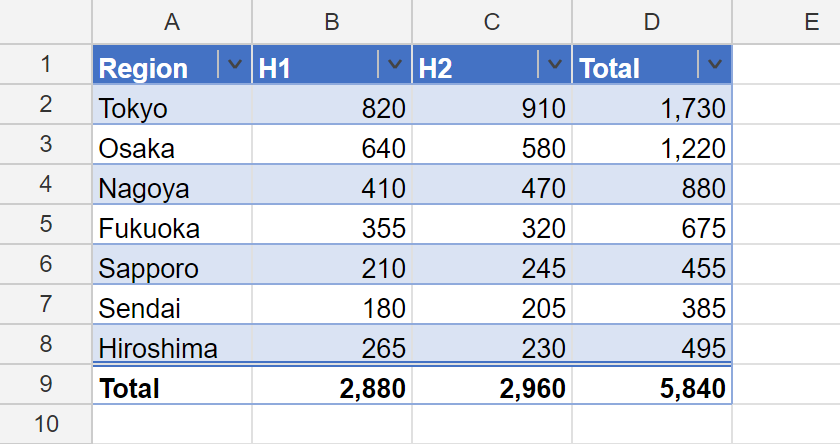
sales.xlsx is a table named Sales, and no cell in it has a fill of its own.AddTabletakes an A1 address, a defined name or aRangePosition. The first row becomes the header, and the column names are read from it.- The table’s colours stay out of the cells. They sit underneath each cell’s own formatting, and a 100,000-row table is still a single object.
XlsxWritersaves it as a real table part, with the filter and totals-row declarations from the previous section, and leaves each cell’s style as it is. - V5 styles the totals row; the formulas are yours. V5 colours the row and declares its contents in the file — the label, and each formula as a custom totals formula — and you write the totals function itself.
SUBTOTAL(109, …)is what Excel would put there. The formulas use plain ranges, since V5 does not evaluate structured references such asSales[H1]yet. ShowFilterButtonis off by default because a worksheet has one auto-filter. Were it on by default, the second table on a sheet would take the buttons off the first.SetFormulatakes the formula without the leading=.
Filter it
The dropdowns are the sheet’s auto-filter, created over the table’s header and data rows — the totals row is left out:
// The table's own filter — ShowFilterButton put it on the header row
ws.AutoFilter!.SetColumnFilter(0, ["Tokyo", "Osaka", "Fukuoka", "Sendai"]);
ws.AutoFilter.Apply();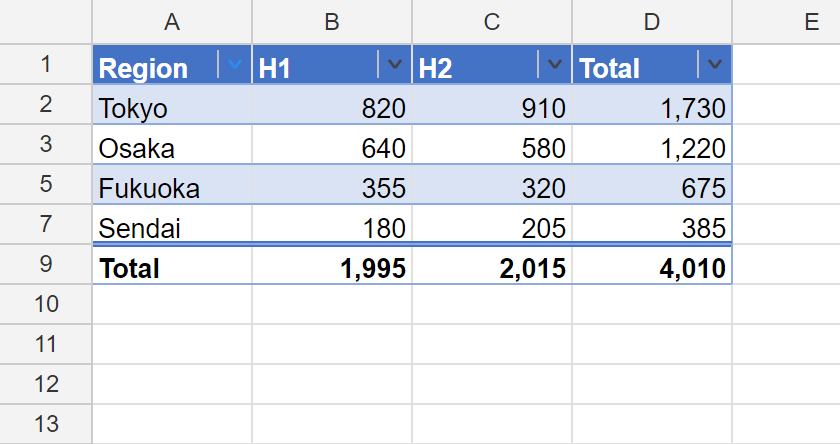
SUBTOTAL(109, …) now adds only what is visible: 1,995 / 2,015 / 4,010.Stripes count visible rows, as Excel’s do, so a filtered table keeps its stripes alternating. And since the totals row is outside the filter, it stays visible whatever you filter for.
The table sits underneath the cells
The table’s colours are the weakest layer a cell has. From strongest to weakest:
- Conditional formatting
- The cell’s own formatting — cell, then row, then column
- The table style
- Sheet-wide banding, outside tables
So painting one row yellow breaks the banding just there, and a conditional format — “flag everything under 300”, say — shows over the stripes. Borders work the same way, edge by edge.
It is also the reason the table’s colours must never be written into the cells when saving. Excel ranks a cell’s own format above the table style, so baked-in stripes would stay put while the rows moved.
The table follows the data it describes: insert a row inside it and it grows and re-bands; insert above it and it moves down; delete a column and that column leaves the column list too.
In a UI
On a ReoGridControl — WinForms, WPF or Avalonia — the same operations are there for the selection:
grid.FormatSelectionAsTable();                                     // Excel's Ctrl+T, filter buttons on
grid.SetActiveTableStyle("TableStyleMedium7", firstColumn: true);  // restyle the table under the cursor
grid.RemoveTableAtActiveCell();                                    // Convert to Range
A single-cell selection formats the sheet’s used range. ReoGrid Studio has the same thing under Format ▸ Format as Table, with all 60 styles and the Table Style Options.
Restyling, and a palette of your own
// Switch the style or its options later — Style is a record struct
table.Style = table.Style with { Name = "TableStyleLight9", ShowFirstColumn = true };

// Or register a palette of your own
TableStyles.Register(new TableStyleDefinition
{
    Name = "BrandTable",
    HeaderFill = 0xFF1F3864,
    HeaderColor = 0xFFFFFFFF,
    HeaderBold = true,
    RowStripeFill = 0xFFEAF0F8,
    WholeBorderColor = 0xFF1F3864,
});
A registered palette works on screen and in PDF output. In an .xlsx it travels as a name only, and Excel draws a table whose style it does not know as a plain table — so for files meant for Excel, stay with the built-ins.
Current limitations
- Totals-row functions. The row is styled, declared and saved; the formulas are yours to write.
- Structured references —
=Sales[H1],=SUBTOTAL(109,Sales[Total]). A workbook from Excel that uses them still opens showing the values Excel calculated (V5 uses those as-is on load), but V5 cannot evaluate them itself. - Auto-expand. A table keeps its range when you type in the row under it.
- Custom style definitions in .xlsx. Built-in names round-trip with their look; custom ones keep only the name.
On V4
ReoGrid V4 opens a list formatted as a table in Excel as plain cells — without the header colour or the stripes, since neither was ever in the cells. If your V4 application loads workbooks your users formatted as tables, that is a reason to look at migrating.
Summary
- “Format as Table” saves an object — a range, a header row, a style name. No cell in the file carries the table’s colours.
- The 60 built-in styles are published definitions. They differ in structure, and their stripe starts on the first data row.
- Excel refuses a file whose sheet-level filter overlaps a table, whose table filter covers the totals row, or whose totals row holds anything undeclared.
- ReoGrid V5.1 creates tables in C# —
AddTablewith a style, filter buttons and a totals row — draws them in a WinForms, WPF or Avalonia app, and writes them as real tables that Excel opens. Headless, too.
See what’s new in V5 / Start a 30-day trial
Further reading
- Table Styles — the options, the fill order, the built-ins and your own palettes
- Filtering — value lists, condition filters, and the two kinds of hidden row
- Banded Rows — sheet-wide striping, outside tables
- XLSX Import and Export
- SUBTOTAL vs AGGREGATE — The Totals That Follow the Filter, and When to Use Each
- Export a DataTable to Excel (.xlsx) in C# Without Office Interop
- Spreadsheet to PDF in C# — No Office, No Printer Driver, No PDF Library