
An Excel table (a ListObject) is an object, not formatting, and V5 treats it as one.
A TableDefinition holds a range, a header row count and a style name; each cell’s colour is
worked out from where it sits inside that range, every time the sheet is drawn.
Because the colours are never baked into the cells:
- a 100,000-row table costs one object,
- inserting a row in the middle re-bands the rest instead of breaking the pattern,
- a cell painted by hand punches through the banding,
- and the file gets a real
xl/tables/tableN.xmlpart rather than a scattering of ad-hoc fills.
The basics
using unvell.ReoGrid.Core;
using unvell.ReoGrid.Core.Tables;

// format A1:D100 as a table, first row as the header (default TableStyleMedium2)
var table = ws.AddTable("A1:D100");

// column names come from the header row
string first = table.Columns[0].Name;

// Excel's "Convert to Range" — the styling was never in the cells, so it just stops
ws.RemoveTable(table.Name);

_ = first;
AddTable takes an A1-style address or a defined name, or a RangePosition. The first row
becomes the header and the column names are read from it — blanks and duplicates are made unique
(Column3, Qty2), because Excel refuses a table whose column names collide.
Style and options
var table = ws.AddTable(RangePosition.Parse("A1:D100"), new AddTableOptions
{
	Name = "Sales",
	Style = "TableStyleMedium7",   // one of the 60 built-ins; the name survives I/O verbatim
	ShowRowStripes = true,         // banded rows (default true)
	ShowFirstColumn = true,        // emphasise the first column
	ShowFilterButton = true,       // filter dropdowns on the header row (default false)
});

// flip the switches later — Style is a record struct, so change it with `with`
table.Style = table.Style with { ShowColumnStripes = true, ShowRowStripes = false };| Option | Default | Meaning |
|---|---|---|
Name | Table1, Table2, … | Unique-in-workbook internal name. It is an identifier — a letter or _ first, then letters, digits, . and _ (no spaces, and nothing that reads as a cell reference like Q1) — because Excel spells it in structured references |
Style | TableStyleMedium2 | Built-in style name. An unknown one is never renamed (see below) |
HeaderRowCount | 1 | 0 or 1 — an Excel table has no multi-row header |
TotalsRowCount | 0 | 0 or 1. The row is coloured and round-trips, but the aggregates are not implemented |
ShowRowStripes | true | Banded rows |
ShowColumnStripes | false | Banded columns |
ShowFirstColumn / ShowLastColumn | false | Emphasise the first / last column |
ShowFilterButton | false | Filter dropdowns on the header row (creates the sheet’s auto-filter over the header and data rows — never the totals row, which stays in view whatever the filter hides, as in Excel) |
ShowFilterButton is off by default because a worksheet holds one auto-filter. On by default,
creating a second table would silently take the buttons off the first.
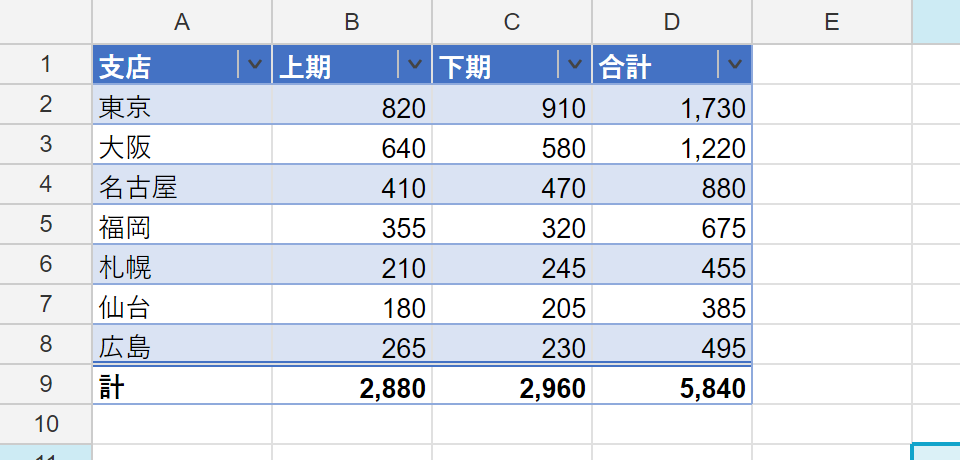
The figure is the default TableStyleMedium2 with ShowFilterButton and TotalsRowCount = 1. The
totals-row formulas (SUBTOTAL(109,B2:B8) here) were put in by the application, not by V5 (see
below).
Banded rows
As in Excel, the stripe starts on the first data row (rows 1, 3, 5, … of the data carry the stripe colour). Rows are counted the way sheet-wide banding counts them — visible rows only — so a filtered table stays evenly striped instead of showing two clean rows side by side. Inside a table the table’s own banding wins, and the sheet’s stripe stops at the table’s edge.
Excel keeps banding inside the table style, which is why this is the striping that round-trips through xlsx (a sheet-wide stripe has no home in the format, and stays reogrid-json only).
Fill order
Strongest first:
- Conditional format
- The cell’s own fill (the cell → row → column style chain)
- The table style
- The sheet stripe (outside the table)
The table joins the inheritance chain as Root ◁ Table ◁ Column ◁ Row ◁ Cell. Being weaker than
anything the cell says for itself is what lets you paint one row yellow and break the banding
just there. Borders work the same way: a hand-drawn border replaces the table’s edge by edge.
Inside the table, the parts of the style stack in Excel’s order (later wins): whole table → column stripes → row stripes → last column → first column → header row → totals row. Each part overrides only what it sets, so a header row with no fill of its own (Medium 22–28, for instance) shows the whole-table fill through it.
Querying
bool any = ws.HasTables;

// the table covering a cell, or null
TableDefinition? at = ws.GetTableAt(5, 2);

// by name (case-insensitive, as in Excel)
TableDefinition? byName = ws.GetTable("Sales");

// the rows carrying data — the range less its header and totals rows
RangePosition data = at?.DataRange ?? default;

// what the table contributes to a cell (the layer below the cell's own style)
var contributed = ws.GetTableStyle(5, 2);

// hand-drawn borders layered over the table's own
CellBorders borders = ws.GetEffectiveBorders(5, 2);

_ = (any, byName, data, contributed, borders);
Built-in styles, and your own
Excel stores only the name — an application is expected to know what TableStyleMedium7 looks
like. What each name looks like is published: ECMA-376 defines the 60 built-ins in
presetTableStyles.xml, and V5 carries those definitions as they are, so the rows that get a
stripe, the edges that get a rule and the text that turns bold all match Excel.
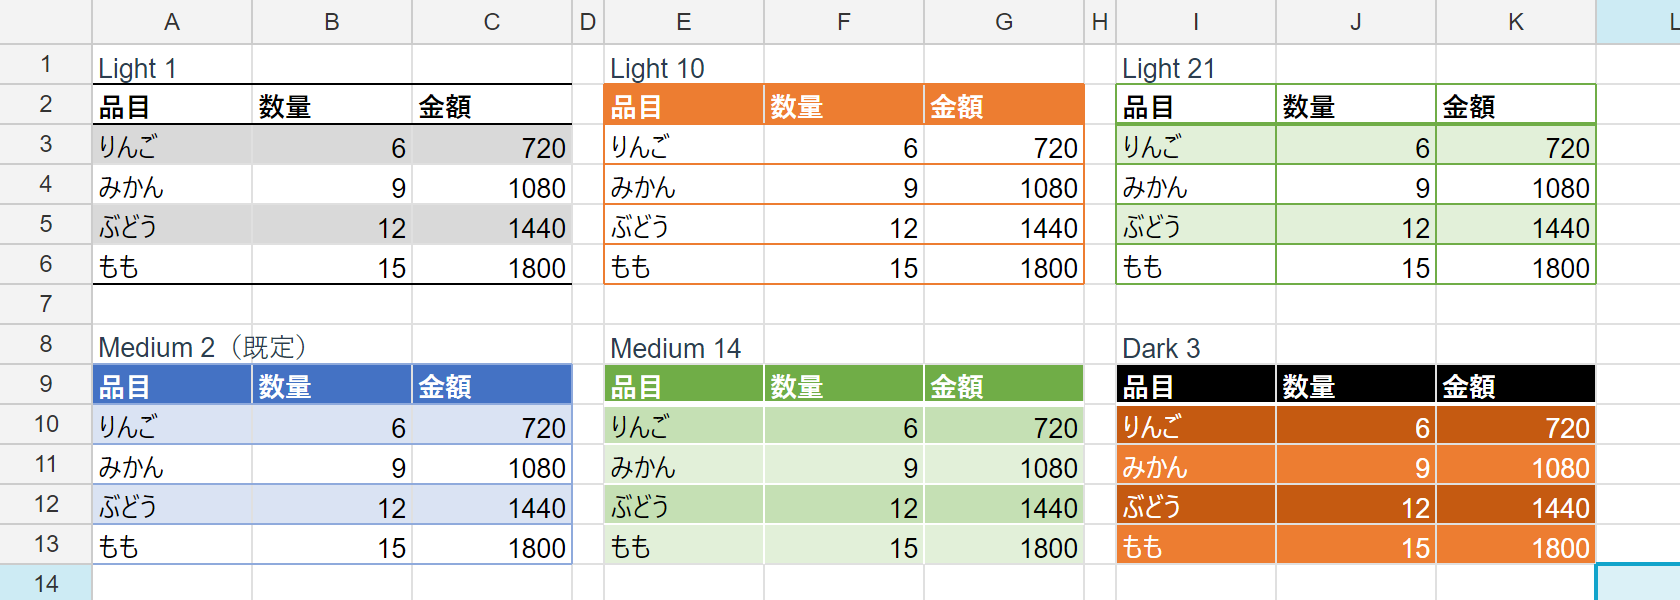
The built-ins are less regular than their names suggest. The Light family alone comes in three
shapes — rules above and below with the text in a darker shade (1–7), a filled header over ruled
bands (8–14), and a full grid (15–21) — and the Dark 9–11 headers take a colour from outside their
own accent. Colours resolve against Office’s default theme (2013 onward) with the same HSL tint curve
OOXML uses, landing within one or two RGB units of the Office swatches (Medium 2’s stripe is #DAE3F3
against Office’s #D9E1F2).
An unknown name renders with the default palette but is never renamed — though only the name
survives. V5 neither reads nor writes custom style definitions (what Excel keeps in styles.xml as
<tableStyles>), so a custom style made in Excel loses its definition when V5 saves the file, and
Excel then shows the table unstyled. A palette registered with TableStyles.Register below is the
same: only its name reaches the file, and in Excel the table has no styling. For files meant for
Excel, use one of the 60 built-ins.
// every built-in name (Light 1–21 / Medium 1–28 / Dark 1–11)
foreach (string name in TableStyles.BuiltinNames())
{
	TableStyleDefinition def = TableStyles.Resolve(name);
	_ = (def.HeaderFill, def.RowStripeFill, def.WholeBorderColor);
}

// register a palette of your own (this may also override a built-in name)
TableStyles.Register(new TableStyleDefinition
{
	Name = "BrandTable",
	HeaderFill = 0xFF1F3864,
	HeaderColor = 0xFFFFFFFF,
	HeaderBold = true,
	RowStripeFill = 0xFFEAF0F8,
	WholeBorderColor = 0xFF1F3864,
});HeaderFill, RowStripeFill and the rest are shorthands. Underneath, a style is a set of
TableStyleElements — Excel’s tableStyleElement: WholeTable, HeaderRow, TotalRow,
FirstColumn, LastColumn, FirstRowStripe, SecondRowStripe, FirstColumnStripe,
SecondColumnStripe — each with a fill, a text colour, bold, its four outer edges and the rules
inside it (Horizontal / Vertical).
// to set line weights and the rules between rows, write it the way Excel's tableStyleElement does
TableStyles.Register(new TableStyleDefinition
{
	Name = "BrandLedger",
	WholeTable = new TableStyleElement
	{
		Horizontal = new BorderEdge(BorderLineStyle.Solid, 0xFFB4C6E7, 1),   // between the rows
		Bottom = new BorderEdge(BorderLineStyle.Solid, 0xFF1F3864, 2),       // the table's bottom edge
	},
	HeaderRow = new TableStyleElement { Fill = 0xFF1F3864, Color = 0xFFFFFFFF, Bold = true },
	FirstRowStripe = new TableStyleElement { Fill = 0xFFEAF0F8 },           // from the first data row
	TotalRow = new TableStyleElement
	{
		Bold = true,
		Top = new BorderEdge(BorderLineStyle.Double, 0xFF1F3864, 3),
	},
});
Inserting and deleting rows and columns
A table follows the data it describes: inserting above it moves it, inserting inside it grows it, and deleting a column cuts that column out of the column list too. A table whose every row is deleted goes with them.
I/O
| Format | What is written |
|---|---|
| reogrid-json | tables (reogrid-web’s JsonTableDefinition shape) |
| XLSX | xl/tables/tableN.xml + the [Content_Types].xml override + the sheet’s _rels + <tableParts>, numbered workbook-wide |
In both formats the table’s colours are not written into the cells. Excel ranks a cell’s own format above the table style, so colours written into the cells would stay put: a sort would carry the stripes off with the rows, and restyling the table would no longer reach them.
For XLSX, three rules keep the file one Excel will open. Break any one of them and Excel refuses the file outright, “repair” included (checked against the desktop Excel):
- The table’s filter (
ShowFilterButton) is written inside the table part, not as the sheet’s<autoFilter>— a sheet filter that overlaps a table stops the file opening. On load, a table’s filter comes back as the sheet’s filter (unless the sheet declared one of its own) - The filter range stops above the totals row
- Whatever the totals row holds is declared on its column: text as
totalsRowLabel, a formula or a value astotalsRowFunction="custom"+<totalsRowFormula>(the cell keeps its own formula as well)
Not there yet
- Totals-row aggregates (
SUBTOTAL) — the row is coloured and round-trips, nothing computes - Structured references (
=Table1[Column]) - Auto-expand when an adjacent cell is edited
- Reading and writing custom table-style definitions (
<tableStyles>in styles.xml)