
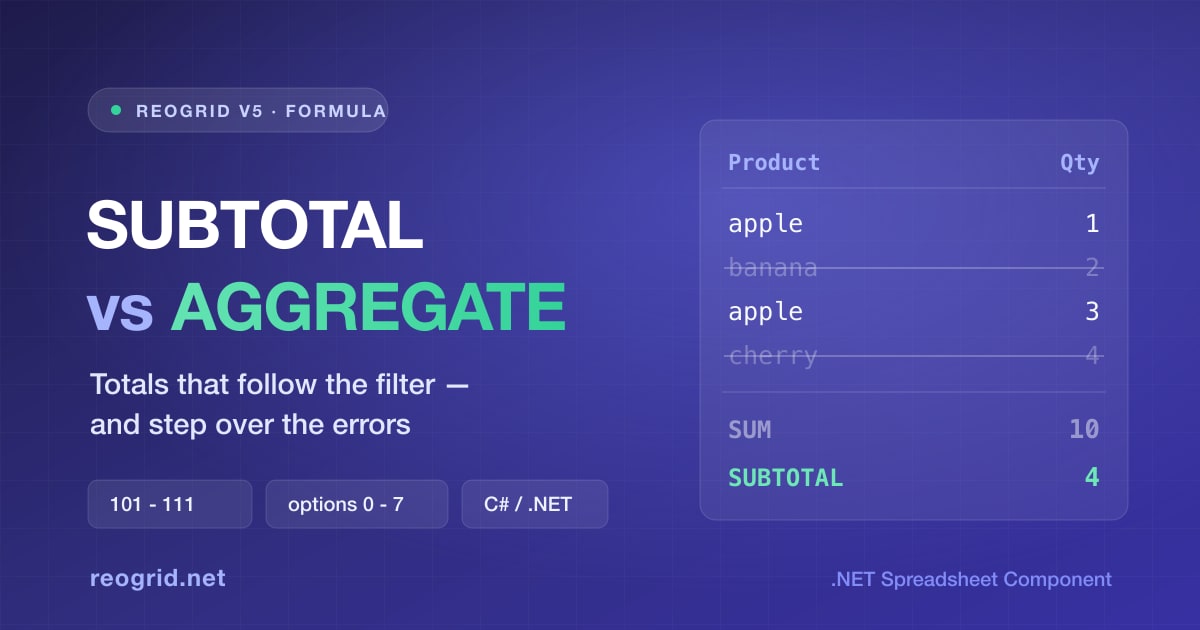
Put a filter on a list, tick one product, and look at the total. It did not move. SUM has no idea a filter exists — it adds every row in the range, visible or not. The number on screen now disagrees with the rows on screen, and someone is going to screenshot it into a report.
Excel’s answer is SUBTOTAL, and its younger, larger sibling AGGREGATE. They are the only two aggregates that care about why a cell is not there: hidden by a filter, hidden by hand, holding an error, or being a sub-total that has already been counted.
ReoGrid V5 implements both. This article sorts out the differences, and shows how to run them inside a C# app — with the filter, the outline, and the headless case that trips people up.
This article is part of the spreadsheet-function series. For pulling values there is VLOOKUP vs HLOOKUP vs XLOOKUP, for positions MATCH vs XMATCH, and for branching IF / IFS / IFERROR.
The short version
SUM etc. | SUBTOTAL | AGGREGATE | |
|---|---|---|---|
| Rows a filter hid | counted | always skipped | always skipped |
| Rows hidden by hand | counted | skipped by 101–111 only | skipped by the odd options |
| Error values in the range | poison the result | poison the result | skippable (options 2/3/6/7) |
| Nested sub-total cells | counted | always skipped | skipped by options 0–3 |
| Functions available | itself | 11 (AVERAGE…VARP) | 19 (adds MEDIAN, LARGE, PERCENTILE, …) |
| Arguments | SUM(ref…) | SUBTOTAL(fn, ref…) | AGGREGATE(fn, options, ref…) |
Two sentences hold most of it:
SUBTOTALis “the total of what you can see.” Filtered-out rows never count; add 100 to the function number and hand-hidden rows stop counting too.AGGREGATEisSUBTOTALplus “ignore the errors” plus eight more functions. Its second argument is what makes it worth the extra typing.
SUBTOTAL — the total of what is visible
SUBTOTAL(function_num, ref1, [ref2], …). The first argument picks which aggregate to run:
| function_num | ||||
|---|---|---|---|---|
1 AVERAGE | 2 COUNT | 3 COUNTA | 4 MAX | 5 MIN |
6 PRODUCT | 7 STDEV | 8 STDEVP | 9 SUM | 10 VAR |
11 VARP |
SUBTOTAL(9, …) is the sum, and it is the one you will write 90% of the time.
1–11 and 101–111 — the difference people get backwards
The same eleven functions appear twice: 1–11 and 101–111. The usual explanation is “the 100s ignore hidden rows”, which leads people to believe that SUBTOTAL(9, …) counts filtered-out rows. It does not.
Filtered-out rows are excluded by both ranges. The 100s add one thing only: rows the user hid by hand are excluded as well.
| Filter hid the row | User hid the row by hand | |
|---|---|---|
SUBTOTAL(9, …) | excluded | counted |
SUBTOTAL(109, …) | excluded | excluded |
So the choice is narrow and it is about intent. 9 means “the total for the current filter” — hiding a row by hand is a display convenience and should not change a number. 109 means “the total of the rows on screen, however they got there”, which is what you want under a collapsed outline.
Columns are not part of this at all: hiding a column never removes anything, in ReoGrid or in Excel. Only rows.
Why a grand total does not double-count
Stack sub-totals under each group and put a grand total at the bottom, and the naive result is double: each value is counted once on its own and again inside its group’s sub-total.
SUBTOTAL handles this itself. A cell in the range that is itself a SUBTOTAL or AGGREGATE is ignored.
A1  1
A2  2
A3  =SUBTOTAL(9,A1:A2)     → 3
A4  4
A5  5
A6  =SUBTOTAL(9,A4:A5)     → 9
A7  =SUBTOTAL(9,A1:A6)     → 12   ← not 24
A8  =SUM(A1:A6)            → 24   ← a plain SUM sees everything
This holds even when the sub-total is buried in an expression — a cell holding =SUBTOTAL(9,A1:A2)*2 is still a sub-total cell and still gets skipped. It is the cell that is marked, not the shape of the formula.
AGGREGATE — the same job, plus the errors
AGGREGATE(function_num, options, ref1, [ref2], …), and for the order statistics AGGREGATE(function_num, options, array, k).
It offers nineteen functions rather than eleven:
| function_num | ||||
|---|---|---|---|---|
1 AVERAGE | 2 COUNT | 3 COUNTA | 4 MAX | 5 MIN |
6 PRODUCT | 7 STDEV | 8 STDEVP | 9 SUM | 10 VAR |
11 VARP | 12 MEDIAN | 13 MODE.SNGL | 14 LARGE | 15 SMALL |
16 PERCENTILE.INC | 17 QUARTILE.INC | 18 PERCENTILE.EXC | 19 QUARTILE.EXC |
14–19 need the extra k at the end: AGGREGATE(14, 6, A1:A100, 2) is “the 2nd largest, ignoring errors.”
The options are a truth table
The second argument is not a mode, it is three independent switches packed into one number.
| options | Nested sub-totals | Hidden rows | Error values |
|---|---|---|---|
0 (default) | ignore | count | count |
1 | ignore | ignore | count |
2 | ignore | count | ignore |
3 | ignore | ignore | ignore |
4 | count | count | count |
5 | count | ignore | count |
6 | count | count | ignore |
7 | count | ignore | ignore |
Read it as bits and it stops needing memorising: 0–3 ignore nested sub-totals, the odd numbers ignore hand-hidden rows, and 2/3/6/7 ignore errors. Filter-hidden rows are outside the table — they are excluded by every option, exactly as with SUBTOTAL.
The reason to reach for it
One #DIV/0! anywhere in a column makes SUM over that column return #DIV/0!. That is correct, and it is also useless when the column is a thousand rows of imported data and three of them divided by a zero quantity.
=SUM(D2:D1000)              → #DIV/0!
=SUBTOTAL(9,D2:D1000)       → #DIV/0!   (it propagates too)
=AGGREGATE(9,6,D2:D1000)    → the sum of the rows that computed
The alternative is wrapping every cell in IFERROR — a thousand formulas edited to work around three. AGGREGATE moves the decision to the one cell that actually wanted it.
Which one to use
- The total under a filter →
SUBTOTAL(9, …). Shorter, and it is what a spreadsheet user expects to find there - The total under a collapsed outline →
SUBTOTAL(109, …) - The range contains errors you want to step over →
AGGREGATE(9, 6, …) - A median, a 3rd-largest, a quartile over filtered data →
AGGREGATE, sinceSUBTOTALstops at 11 - You want everything counted, always → plain
SUM. Reaching forAGGREGATE(9, 4, …)to get “count everything” works, but says the opposite of what you mean to the next reader
Running them in C# — ReoGrid V5
Both are core functions, so the code below is identical on WinForms, WPF and Avalonia, and runs headless with no UI at all.
using unvell.ReoGrid.Core;
using unvell.ReoGrid.Core.Filtering;

var workbook = new Workbook();
var sheet = workbook.AddWorksheet("Orders");

sheet.SetText(0, 0, "Product");  sheet.SetText(0, 1, "Qty");
sheet.SetText(1, 0, "apple");    sheet.SetNumber(1, 1, 1);
sheet.SetText(2, 0, "banana");   sheet.SetNumber(2, 1, 2);
sheet.SetText(3, 0, "apple");    sheet.SetNumber(3, 1, 3);
sheet.SetText(4, 0, "cherry");   sheet.SetNumber(4, 1, 4);

sheet.SetFormula(5, 1, "SUBTOTAL(9,B2:B5)");   // the visible total
sheet.SetFormula(6, 1, "SUM(B2:B5)");          // for comparison

// Filter down to "apple"
var filter = sheet.CreateAutoFilter(RangePosition.Parse("A1:B5"));
filter.SetColumnFilter(0, ["apple"]);
filter.Apply();

double visible = sheet.GetValue(5, 1).AsNumber;   // 4  (1 + 3)
double all     = sheet.GetValue(6, 1).AsNumber;   // 10

filter.ClearAll();                                // B6 goes back to 10
SetFormula takes the formula without a leading = — "SUBTOTAL(9,B2:B5)", not "=SUBTOTAL(...)". The = is the editor’s prefix, not part of the formula.
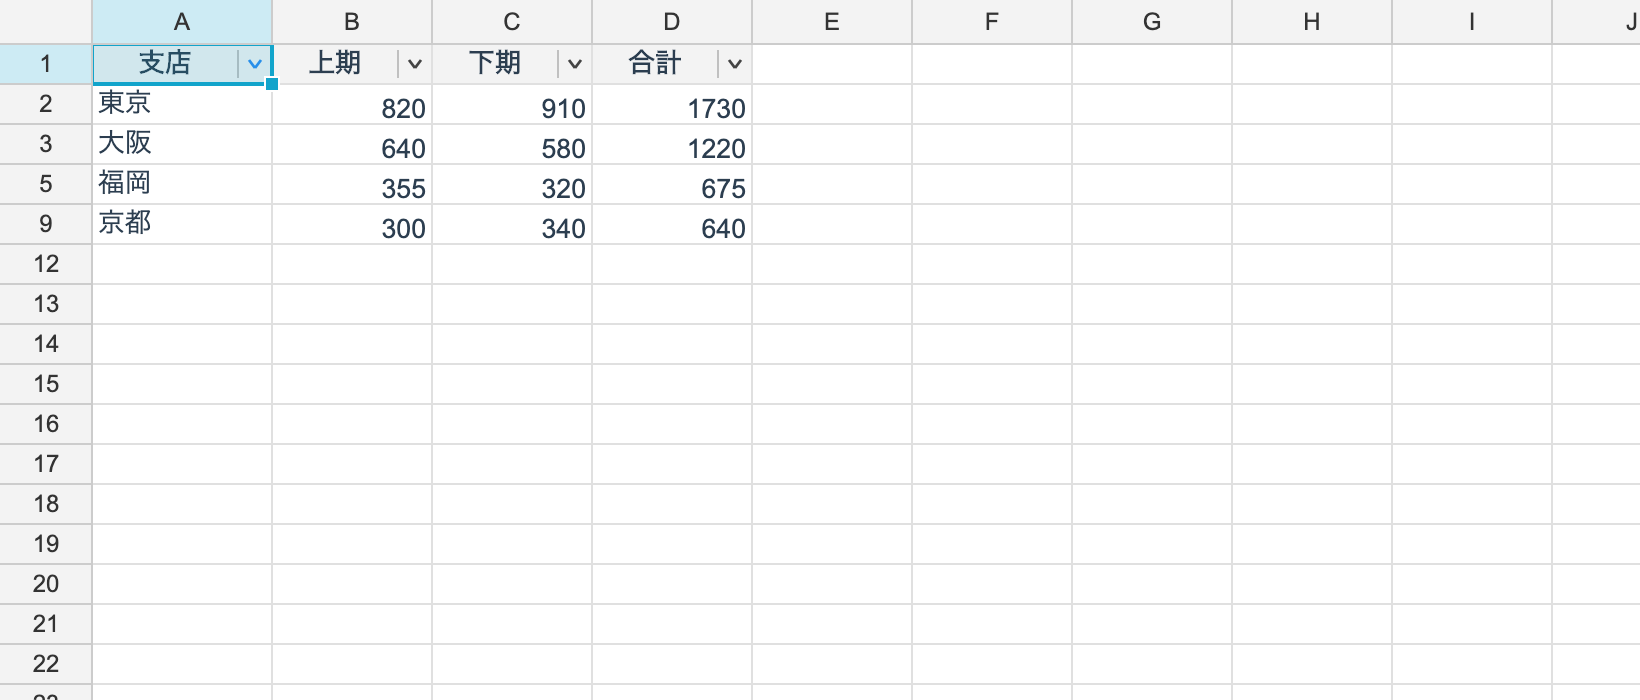
Apply() refreshes the aggregates for you, and so does ClearAll(), collapsing an outline, and undo.
The one call to remember: SyncAggregateFormulas()
Row visibility is not a cell edit, so it is not in the dependency graph — nothing about hiding a row looks like a value changing. In an on-screen app that is invisible to you: a hand-hidden row is picked up the next time the grid paints. Headless, there is no paint, so you say so yourself:
sheet.SetFormula(6, 1, "SUBTOTAL(109,B2:B5)");   // the 100s range

sheet.Rows.SetHidden(2, true);      // hide "banana" by hand
sheet.SyncAggregateFormulas();      // no paint is coming — ask for the refresh

double onScreen = sheet.GetValue(6, 1).AsNumber;   // 8  (10 − 2)
It is a no-op when no row actually changed visibility, so calling it after a batch of hides costs nothing.
Under an outline
var group = sheet.GroupRows(1, 4);       // group the four data rows
sheet.RowOutlines.Collapse(group);

sheet.GetValue(5, 1).AsNumber;           // 10 — SUBTOTAL(9) keeps hidden rows
sheet.GetValue(6, 1).AsNumber;           //  4 — SUBTOTAL(109) sees only what is left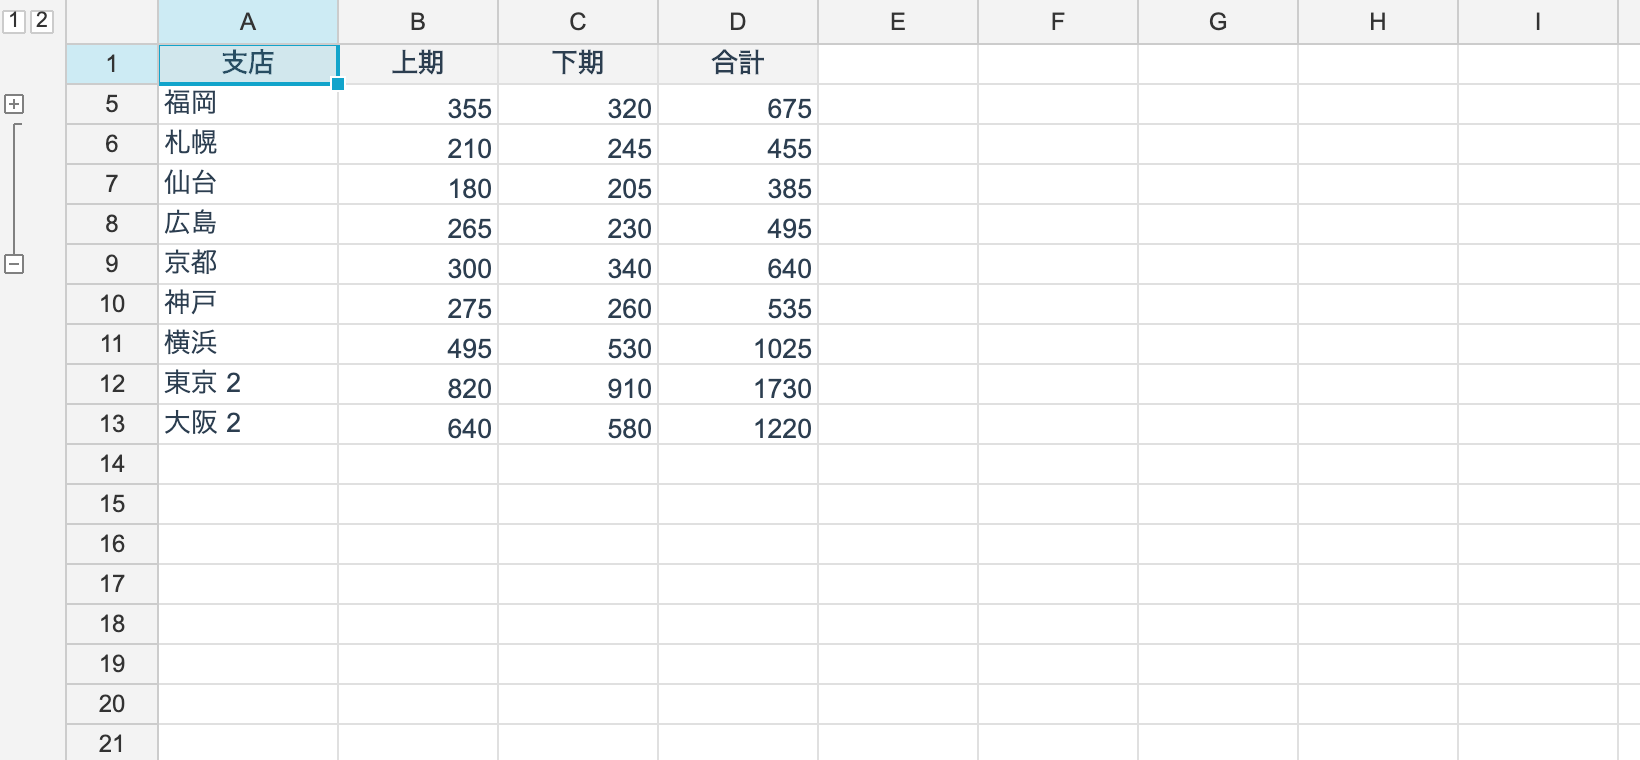
This is the case 109 exists for, and the clearest demonstration that the two ranges are not interchangeable.
Across sheets
A SUBTOTAL may point at another sheet, and it reads that sheet’s hidden rows:
var summary = workbook.AddWorksheet("Summary");
summary.SetFormula(0, 0, "SUBTOTAL(109,Orders!B2:B5)");

sheet.Rows.SetHidden(2, true);
summary.SyncAggregateFormulas();         // the reading sheet does the refresh
Note which sheet the call goes to: the formula lives on Summary, so Summary is what needs refreshing.
Excel-compatible corners worth knowing
MAX/MINover nothing return0, not an error — the same as Excel.AVERAGEover nothing returns#DIV/0!MODE.SNGLwith no repeated value returns#N/A. Ties go to whichever value appears firstPERCENTILE.EXCandQUARTILE.EXCcannot reach the extremes by construction, soQUARTILE.EXC(…, 0)is#NUM!, not the minimum- A
function_numoutside the table, or anoptionsoutside0–7, is#VALUE!. Akpast the end of the data is#NUM! - Literal arguments work —
SUBTOTAL(9, 1, 2, 3)is6— and they coerce the waySUM’s do SUBTOTALhas no way to ignore errors. If that is what you need, the answer isAGGREGATE, not a larger function number
On V4
These two are V5 only. ReoGrid V4 — 4.5 and 4.6 included — has neither. A workbook that uses them still loads, but V4’s evaluator returns nothing at all for a function it does not recognise, so those cells come out blank rather than as an error. A total that silently reads as empty is much easier to miss in review than a #NAME?. If you have a V4 application whose users filter a list and read the total underneath, that is a reason to look at migrating.
Summary
SUMdoes not know about filters. A total under a filtered list has to beSUBTOTALorAGGREGATE- Filter-hidden rows are excluded by both, and by every
AGGREGATEoption. The101–111range adds hand-hidden rows only - A cell that is itself a sub-total is skipped, so a grand total over the whole column is correct without excluding the sub-total rows by hand
AGGREGATE’s second argument is three switches: nested sub-totals, hidden rows, errors.AGGREGATE(9, 6, …)is the “sum what computed” you keep wanting- It also carries
MEDIAN,MODE.SNGL,LARGE,SMALL,PERCENTILEandQUARTILE— the statisticsSUBTOTALnever had - ReoGrid V5 runs all of it inside a WinForms / WPF / Avalonia app and headless. Hiding rows from your own code? Call
SyncAggregateFormulas()
See what’s new in V5 / Start a 30-day trial
Further reading
- Function Reference — every built-in function, and where V5 differs from Excel
- Filtering — value lists, condition filters, and the two kinds of hidden row
- Outlines — grouping, levels, and where the summary line sits
- MATCH vs XMATCH — The Lookup Functions That Return a Position
- VLOOKUP vs HLOOKUP vs XLOOKUP — Knowing the Difference and Using Them in a C# Spreadsheet
- Building an Input Sheet Users Can’t Break