Area Chart
To add an area chart on worksheet, prepare a data source on worksheet firstly:
var worksheet = grid.CurrentWorksheet;

worksheet["A2"] = new object[,] {
  { null, 2008, 2009, 2010, 2011, 2012 },
  { "City 1", 3, 2, 4, 2, 6 },
  { "City 2", 7, 5, 3, 6, 4 },
  { "City 3", 13, 10, 9, 10, 9 },
  { "Total", "=SUM(B3:B5)", "=SUM(C3:C5)", "=SUM(D3:D5)", "=SUM(E3:E5)", "=SUM(F3:F5)" },
};
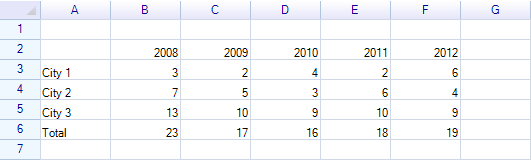
Data source on worksheet:
Define data serials range, serial names range and category names range.
var dataRange = worksheet.Ranges["B3:F5"];
var serialNamesRange = worksheet.Ranges["A3:A5"];
var categoryNamesRange = worksheet.Ranges["B2:F2"];

worksheet.AddHighlightRange(categoryNamesRange);
worksheet.AddHighlightRange(serialNamesRange);
worksheet.AddHighlightRange(dataRange);
Code to create an area chart:
var chart = new Chart.AreaLineChart
{
  Bounds = new Graphics.Rectangle(30, 150, 400, 240),

  Title = "Area Line Chart Sample",

  // Specify data source.
  // Data source is created from serial data and names for every serial data.
  DataSource = new Chart.WorksheetChartDataSource(worksheet, serialNamesRange, dataRange)
  {
    CategoryNameRange = categoryNamesRange,
  },
};
Add chart onto worksheet:
// add area chart onto worksheet, it will be displayed instantly
worksheet.FloatingObjects.Add(chart);
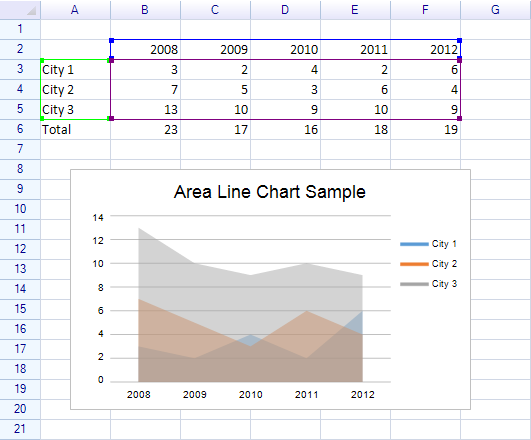
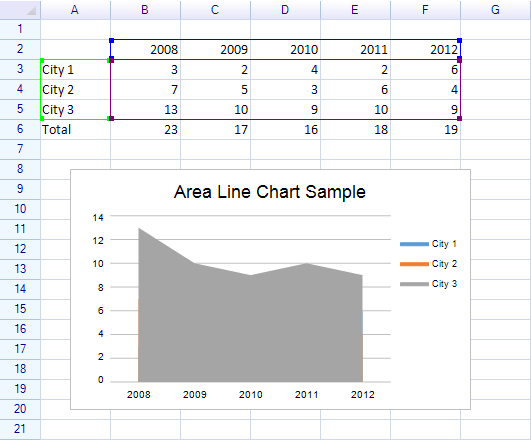
Result:
Since the biggest area will cover others smaller area, access the data serial styles and change all colors to semi-transparent.
// Make all serial colors semi-transparent
foreach (var style in chart.DataSerialStyles)
{
  style.FillColor = new Graphics.SolidColor(100, style.FillColor.ToSolidColor());
}
Result: