ReoGrid supports various chart types that can be displayed on worksheets as floating objects. Charts update automatically when their data source changes, and they are saved/loaded with Excel files.
Namespace
using unvell.ReoGrid.Chart;
using unvell.ReoGrid.Drawing;
Available Chart Types
| Class | Sample | Description |
|---|
ColumnChart | 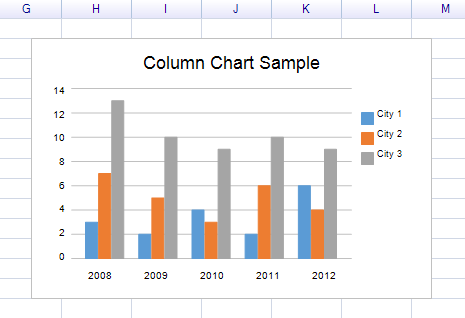 | Vertical bar chart |
BarChart | 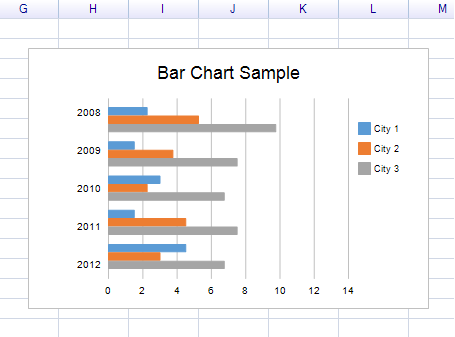 | Horizontal bar chart |
LineChart | 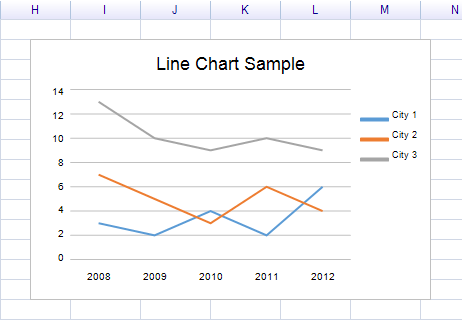 | Line chart |
AreaChart | 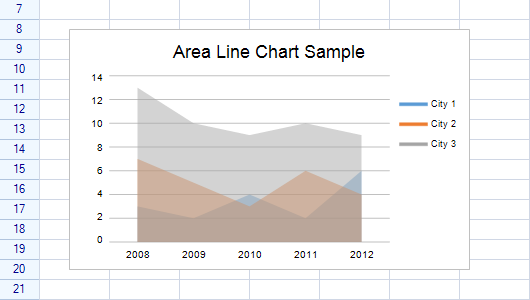 | Filled area chart |
Pie2DChart | 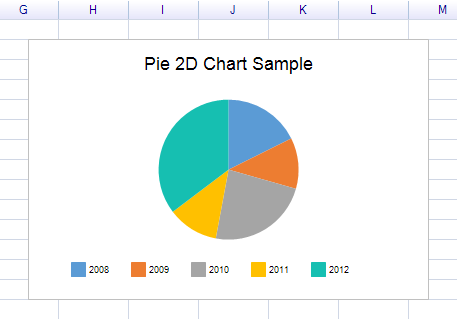 | 2D pie chart |
DoughnutChart | 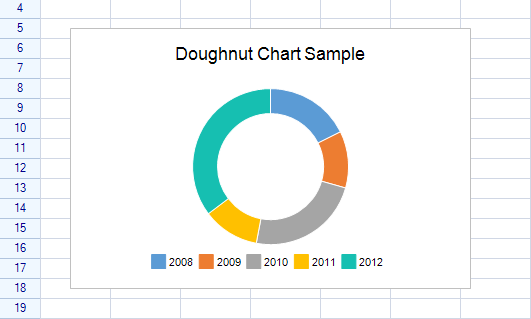 | Doughnut chart |
Creating a Chart
Step 1: Prepare Data
var sheet = grid.CurrentWorksheet;

sheet["A2"] = new object[,] {
    { null, 2008, 2009, 2010, 2011, 2012 },
    { "City 1", 3, 2, 4, 2, 6 },
    { "City 2", 7, 5, 3, 6, 4 },
    { "City 3", 13, 10, 9, 10, 9 },
};
Step 2: Define Ranges
var dataRange = sheet.Ranges["B3:F5"];           // The numeric data
var serialNamesRange = sheet.Ranges["A3:A5"];    // Series names (row headers)
var categoryNamesRange = sheet.Ranges["B2:F2"];  // Category names (column headers)
Step 3: Create the Chart
var chart = new ColumnChart
{
    Location = new Graphics.Point(220, 160),
    Size = new Graphics.Size(400, 260),
    Title = "Column Chart Sample",
    DataSource = new WorksheetChartDataSource(sheet, serialNamesRange, dataRange)
    {
        CategoryNameRange = categoryNamesRange,
    },
};
Step 4: Add to Worksheet
sheet.FloatingObjects.Add(chart);
Chart Properties
All chart types inherit from the Chart base class:
| Property | Type | Default | Description |
|---|
Title | string | "Chart" | Chart title text |
DataSource | WorksheetChartDataSource | null | The chart’s data source |
ShowLegend | bool | true | Whether to show the legend |
PrimaryLegend | ChartLegend | — | The chart’s legend instance |
DataSerialStyles | DataSerialStyleCollection | — | Styles for each data series |
Location | Graphics.Point | — | Top-left position on the worksheet |
Size | Graphics.Size | — | Width and height |
Bounds | Graphics.Rectangle | — | Position and size combined |
Visible | bool | true | Whether the chart is visible |
Events
| Event | Description |
|---|
ChartDataChanged | Raised when chart data is updated |
DataSourceChanged | Raised when the data source is changed |
Data Source
WorksheetChartDataSource
Connects worksheet data to a chart:
// Constructor with ranges
var dataSource = new WorksheetChartDataSource(sheet, serialNamesRange, dataRange)
{
    CategoryNameRange = categoryNamesRange,
};

// Constructor with string addresses
var dataSource = new WorksheetChartDataSource(sheet, "A3:A5", "B3:F5")
{
    CategoryNameRange = sheet.Ranges["B2:F2"],
};
Constructors
| Constructor | Description |
|---|
WorksheetChartDataSource(worksheet) | Empty data source |
WorksheetChartDataSource(worksheet, serialNamesRange, dataRange) | With series names and data ranges |
WorksheetChartDataSource(worksheet, serialNamesRange, dataRange, rowOrColumn) | Specify whether series are in rows or columns |
Properties
| Property | Type | Description |
|---|
Worksheet | Worksheet | The worksheet containing the data |
CategoryNameRange | RangePosition | Range containing category labels |
SerialCount | int | Number of data series (read-only) |
CategoryCount | int | Number of categories (read-only) |
Serials | WorksheetChartDataSerialCollection | Collection of data series |
Methods
| Method | Description |
|---|
GetCategoryName(int index) | Get category label by index |
AddSerial(worksheet, labelAddress, dataRange) | Add a data series manually |
GetSerial(int index) | Get a specific data series |
Events
| Event | Description |
|---|
DataChanged | Raised when the source data changes |
WorksheetChartDataSerial
Represents one data series in the chart:
| Property | Type | Description |
|---|
Worksheet | Worksheet | The worksheet containing the data |
DataRange | RangePosition | Range containing the series data |
LabelAddress | CellPosition | Address of the series label cell |
Label | string | Series name (read-only) |
Count | int | Number of data points (read-only) |
this[int index] | double? | Get data value by index |
Data Series Styles
Customize the appearance of each data series:
// Access styles by index
var style = chart.DataSerialStyles[0];
| Property | Type | Default | Description |
|---|
FillColor | IColor | (auto) | Fill color for bars, areas, pie slices |
LineColor | SolidColor | (auto) | Line color for line charts |
LineWidth | RGFloat | 2f | Line width |
LineStyle | LineStyles | Solid | Line style (Solid, Dash, Dot, etc.) |
StartCap | LineCapStyles | None | Start cap style |
EndCap | LineCapStyles | None | End cap style |
Example: Semi-Transparent Area Chart
foreach (var style in chart.DataSerialStyles)
{
    style.FillColor = new Graphics.SolidColor(100, style.FillColor.ToSolidColor());
}
Legend
Control the chart legend:
// Hide the legend
chart.ShowLegend = false;

// Access legend properties
var legend = chart.PrimaryLegend;
LegendPosition Enum
| Value | Description |
|---|
Right | Legend on the right side (default) |
Bottom | Legend at the bottom |
Left | Legend on the left side |
Top | Legend at the top |
Axis Configuration (Axis Charts Only)
Column, Bar, Line, and Area charts inherit from AxisChart and support axis configuration:
| Property | Type | Description |
|---|
PrimaryAxisInfo | AxisDataInfo | Primary axis configuration |
SecondaryAxisInfo | AxisDataInfo | Secondary axis configuration |
ShowHorizontalGuideLines | bool | Show horizontal guide lines (default: true) |
ShowVerticalGuideLines | bool | Show vertical guide lines (default: false) |
AxisDataInfo Properties
| Property | Type | Description |
|---|
Levels | int | Number of axis levels |
Scaler | int | Axis scaler |
Minimum | double | Axis minimum value |
Maximum | double | Axis maximum value |
AutoMinimum | bool | Automatically determine minimum |
AutoMaximum | bool | Automatically determine maximum |
LargeStride | double | Large stride value (major gridlines) |
SmallStride | double | Small stride value (minor gridlines) |
Highlight Ranges
Highlight the data ranges on the worksheet to visually indicate the chart’s data source:
sheet.AddHighlightRange(dataRange);
sheet.AddHighlightRange(serialNamesRange);
sheet.AddHighlightRange(categoryNamesRange);
Chart Type Details
Class Hierarchy
FloatingObject
  └─ DrawingObject
      └─ DrawingComponent
          └─ Chart (base)
              ├─ AxisChart
              │   ├─ ColumnChart
              │   │   └─ BarChart
              │   ├─ LineChart
              │   └─ AreaChart
              └─ PieChart
                  ├─ Pie2DChart
                  └─ DoughnutChart