The DoughnutChart is similar to a pie chart but with a hollow center. It inherits from PieChart.
Example
Prepare Data
var sheet = grid.CurrentWorksheet;
sheet["A2"] = new object[,] {
{ null, 2008, 2009, 2010, 2011, 2012 },
{ "City A", 3, 2, 4, 2, 6 },
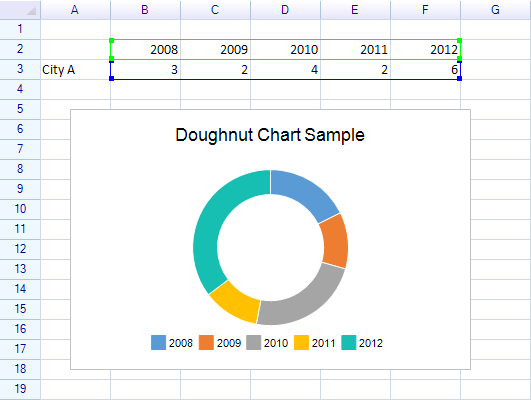
};Define Ranges and Create Chart
var dataRange = sheet.Ranges["B3:F3"];
var categoryNamesRange = sheet.Ranges["B2:F2"];

sheet.AddHighlightRange(dataRange);
sheet.AddHighlightRange(categoryNamesRange);

var chart = new Chart.DoughnutChart
{
    Location = new Graphics.Point(30, 90),
    Size = new Graphics.Size(400, 260),
    Title = "Doughnut Chart Sample",
    DataSource = new WorksheetChartDataSource(sheet,
        categoryNamesRange, dataRange, RowOrColumn.Column),
};

sheet.FloatingObjects.Add(chart);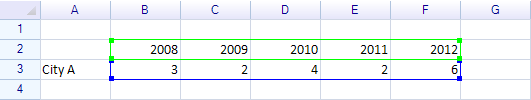
Result:
Customization
Segment Colors
chart.DataSerialStyles[0].FillColor = Graphics.SolidColor.CornflowerBlue;
chart.DataSerialStyles[1].FillColor = Graphics.SolidColor.LightCoral;
Related Topics
- Chart Overview — Chart base properties and data sources
- Pie 2D Chart — Solid pie variant