ReoGrid supports various chart types that can be displayed on worksheets as floating objects. Charts update automatically when their data source changes, and they are loaded from Excel files. Charts are not written when saving to Excel.
Namespace
using unvell.ReoGrid.Chart;
using unvell.ReoGrid.Drawing;
Available Chart Types
| Class | Sample | Description |
|---|
ColumnChart | 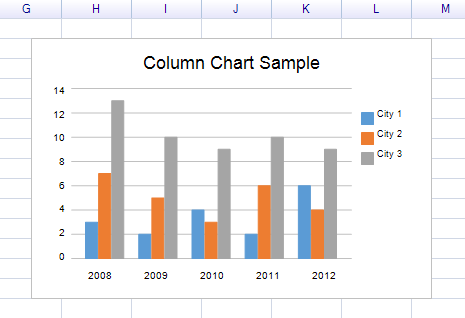 | Vertical bar chart |
BarChart | 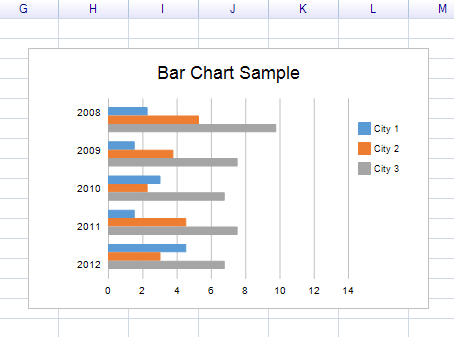 | Horizontal bar chart |
LineChart | 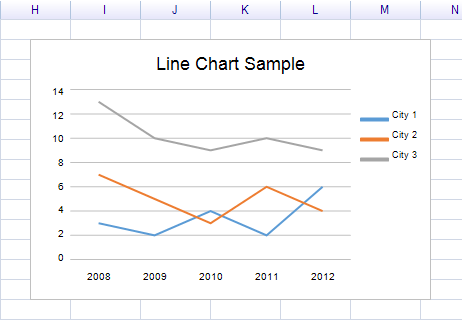 | Line chart |
AreaChart | 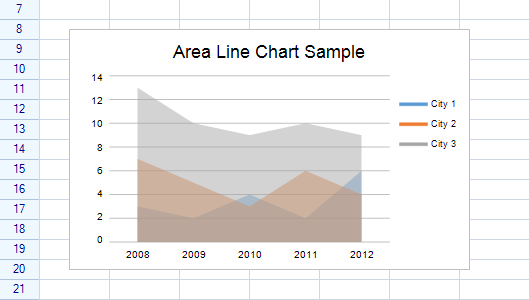 | Filled area chart |
Pie2DChart | 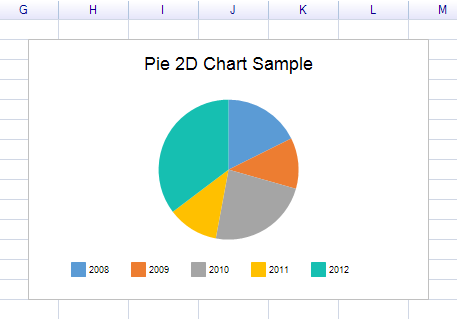 | 2D pie chart |
DoughnutChart | 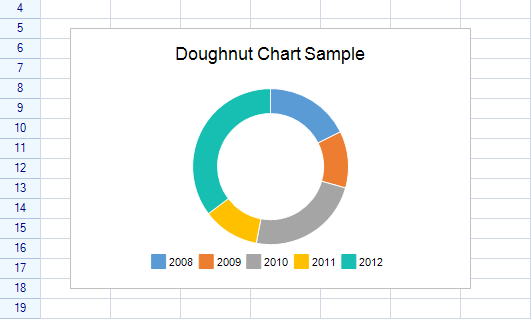 | Doughnut chart |
Creating a Chart
Step 1: Prepare Data
var sheet = grid.CurrentWorksheet;

sheet["A2"] = new object[,] {
    { null, 2008, 2009, 2010, 2011, 2012 },
    { "City 1", 3, 2, 4, 2, 6 },
    { "City 2", 7, 5, 3, 6, 4 },
    { "City 3", 13, 10, 9, 10, 9 },
};
Step 2: Define Ranges
var dataRange = sheet.Ranges["B3:F5"];           // The numeric data
var serialNamesRange = sheet.Ranges["A3:A5"];    // Series names (row headers)
var categoryNamesRange = sheet.Ranges["B2:F2"];  // Category names (column headers)
Step 3: Create the Chart
var chart = new ColumnChart
{
    Location = new Graphics.Point(220, 160),
    Size = new Graphics.Size(400, 260),
    Title = "Column Chart Sample",
    DataSource = new WorksheetChartDataSource(sheet, serialNamesRange, dataRange)
    {
        CategoryNameRange = categoryNamesRange,
    },
};
Step 4: Add to Worksheet
sheet.FloatingObjects.Add(chart);
Chart Properties
All chart types inherit from the Chart base class:
| Property | Type | Default | Description |
|---|
Title | string | "Chart" | Chart title text |
DataSource | WorksheetChartDataSource | null | The chart’s data source |
ShowLegend | bool | true | Whether to show the legend |
PrimaryLegend | ChartLegend | — | The chart’s legend instance |
DataSerialStyles | DataSerialStyleCollection | — | Styles for each data series |
Location | Graphics.Point | — | Top-left position on the worksheet |
Size | Graphics.Size | — | Width and height |
Bounds | Graphics.Rectangle | — | Position and size combined |
Visible | bool | true | Whether the chart is visible |
Events
| Event | Description |
|---|
ChartDataChanged | Raised when chart data is updated |
DataSourceChanged | Raised when the data source is changed |
Data Source
WorksheetChartDataSource
Connects worksheet data to a chart:
// Constructor with ranges
var dataSource = new WorksheetChartDataSource(sheet, serialNamesRange, dataRange)
{
    CategoryNameRange = categoryNamesRange,
};

// Constructor with string addresses
var dataSource = new WorksheetChartDataSource(sheet, "A3:A5", "B3:F5")
{
    CategoryNameRange = sheet.Ranges["B2:F2"],
};
Constructors
| Constructor | Description |
|---|
WorksheetChartDataSource(worksheet) | Empty data source |
WorksheetChartDataSource(worksheet, serialNamesRange, dataRange) | With series names and data ranges |
WorksheetChartDataSource(worksheet, serialNamesRange, dataRange, rowOrColumn) | Specify whether series are in rows or columns |
Properties
| Property | Type | Description |
|---|
Worksheet | Worksheet | The worksheet containing the data |
CategoryNameRange | RangePosition | Range containing category labels |
SerialCount | int | Number of data series (read-only) |
CategoryCount | int | Number of categories (read-only) |
Serials | WorksheetChartDataSerialCollection | Collection of data series |
Methods
| Method | Description |
|---|
GetCategoryName(int index) | Get category label by index |
AddSerial(worksheet, labelAddress, dataRange) | Add a data series manually |
GetSerial(int index) | Get a specific data series |
Events
| Event | Description |
|---|
DataChanged | Raised when the source data changes |
WorksheetChartDataSerial
Represents one data series in the chart:
| Property | Type | Description |
|---|
Worksheet | Worksheet | The worksheet containing the data |
DataRange | RangePosition | Range containing the series data |
LabelAddress | CellPosition | Address of the series label cell |
Label | string | Series name (read-only) |
Count | int | Number of data points (read-only) |
this[int index] | double? | Get data value by index |
Data Series Styles
Customize the appearance of each data series:
// Access styles by index
var style = chart.DataSerialStyles[0];
| Property | Type | Default | Description |
|---|
FillColor | IColor | (auto) | Fill color for bars, areas, pie slices |
LineColor | SolidColor | (auto) | Line color for line charts |
LineWidth | RGFloat | 2f | Line width |
LineStyle | LineStyles | Solid | Line style (Solid, Dash, Dot, etc.) |
StartCap | LineCapStyles | None | Start cap style |
EndCap | LineCapStyles | None | End cap style |
Example: Semi-Transparent Area Chart
foreach (var style in chart.DataSerialStyles)
{
    style.FillColor = new Graphics.SolidColor(100, style.FillColor.ToSolidColor());
}
Legend
Control the chart legend:
// Hide the legend
chart.ShowLegend = false;

// Access legend properties
var legend = chart.PrimaryLegend;
LegendPosition Enum
| Value | Description |
|---|
Right | Legend on the right side (default) |
Bottom | Legend at the bottom |
Left | Legend on the left side |
Top | Legend at the top |
Axis Configuration (Axis Charts Only)
Column, Bar, Line, and Area charts inherit from AxisChart and support axis configuration:
| Property | Type | Description |
|---|
PrimaryAxisInfo | AxisDataInfo | Primary axis configuration |
SecondaryAxisInfo | AxisDataInfo | Secondary axis configuration |
ShowHorizontalGuideLines | bool | Show horizontal guide lines (default: true) |
ShowVerticalGuideLines | bool | Show vertical guide lines (default: false) |
AxisDataInfo Properties
| Property | Type | Description |
|---|
Levels | int | Number of axis levels |
Scaler | int | Axis scaler |
Minimum | double | Axis minimum value |
Maximum | double | Axis maximum value |
AutoMinimum | bool | Automatically determine minimum |
AutoMaximum | bool | Automatically determine maximum |
LargeStride | double | Large stride value (major gridlines) |
SmallStride | double | Small stride value (minor gridlines) |
Highlight Ranges
Highlight the data ranges on the worksheet to visually indicate the chart’s data source:
sheet.AddHighlightRange(dataRange);
sheet.AddHighlightRange(serialNamesRange);
sheet.AddHighlightRange(categoryNamesRange);
Chart Type Details
Class Hierarchy
FloatingObject
  └─ DrawingObject
      └─ DrawingComponent
          └─ Chart (base)
              ├─ AxisChart
              │   ├─ ColumnChart
              │   │   └─ BarChart
              │   ├─ LineChart
              │   └─ AreaChart
              └─ PieChart
                  ├─ Pie2DChart
                  └─ DoughnutChart
